
Figures & data
Figure 1 The process (time course) of the experiment.
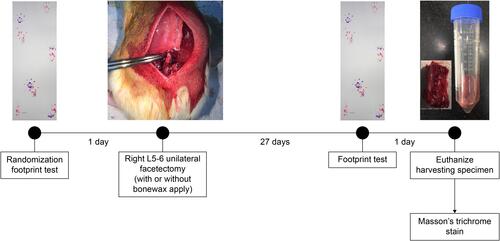
Figure 2 Facetectomy of the right L5-6 facet joint. (A) Normal facet on right L5-6. (B) In group A, subcutaneous tissue and skin were closed immediately after right facetectomy, and the surgery was completed. (C) In group B, bone wax was applied to the facetectomy site, the subcutaneous tissue and skin were closed, and the surgery was completed. The images are those of Sample #2 from Group A and Sample #1 from Group B.
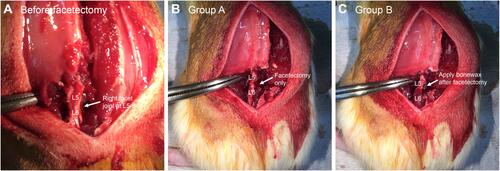
Figure 3 Schematic illustration of the prefabricated crate for the footprint test. (A) Schematic illustration of the crate for the rats to go through. (B) The ramp made for a rat to climb inside a crate. (C) The ramp was set in the crate. The rat leaves footprints as it climbs the ramp set in the crate.
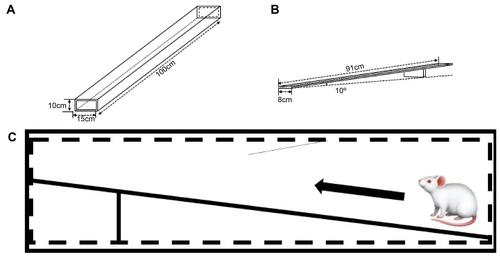
Figure 4 Measurement of stride length using footprint test. The blue footprints are for the forefoot, and the red footprints are for the hindfoot. Stride length is defined as the distance between the bases of the footprints of the hindfoot (red). The image is that of Sample #4 from Group A.
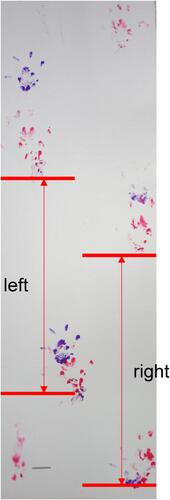
Figure 5 Microscopic (Eclipse TE300 inverted microscope, NiconⓇ, Japan) images of slides at L5-6. The slides are made from the harvested lumbar spine at L5-6 4 weeks after surgery. The facet joint area includes the superior articular process and joint space (area in dark blue line). All photographs were taken using 10× magnification. The areas were measured using ImageJ software. (A) Group A (control) and (B) group B (bone wax). The images are those of Sample #6 from Group A and Sample #1 from Group B.
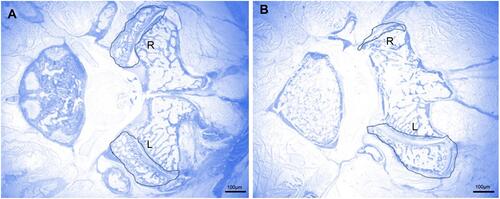
Table 1 Facet Joint Area (Unit: µm2)
Table 2 Stride Lengths from the Footprint Analysis (Unit: cm)