Figures & data
Figure 1 Flow of patients through this retrospective study.
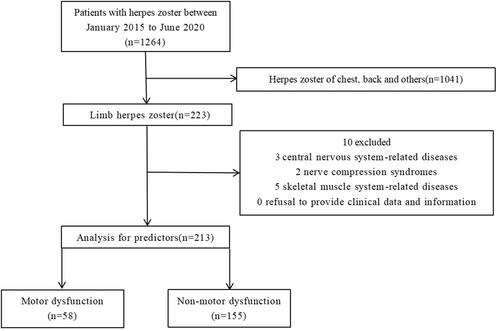
Table 1 Demographic or Characteristic Date of Motor Dysfunction Group and Nonmotor Dysfunction Group
Table 2 Univariate Logistic Regression of Motor Dysfunction in Patients with Limb Herpes Zoster
Table 3 Multivariable Logistic Regression of Motor Dysfunction in Patients with Limb Herpes Zoster
Figure 2 Nomogram for prediction of motor dysfunction in patients with limb herpes zoster.
Notes: Different values of each variable correspond to different positions in the nomogram. Draw a line from the position of each variable to the points axis for acquiring points of this variable. Points of different variables are calculated and summed to yield a total score that can be converted into predicted probability of motor dysfunction based on the total score axis of the nomogram.
Abbreviations: LOI, location of involvement; CD, combine diseases; NOAC, the number of affected centrums.
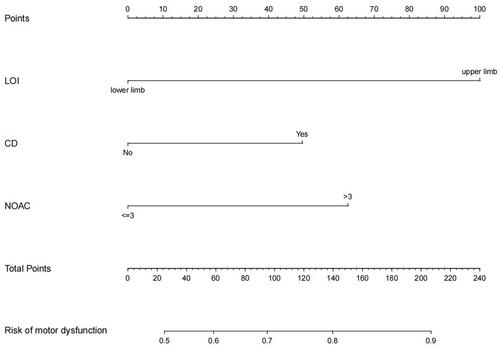
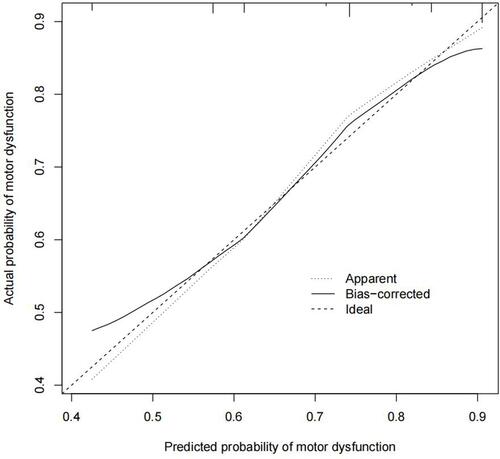
Figure 3 Calibration plot.
Notes: The y-axis is the actual probability. The x-axis is the predicted probability. The diagonal dotted line represents a perfect prediction by an ideal model. The solid line represents the bias-corrected performance of the nomogram, where a closer fit to the diagonal dotted line represents a better prediction.