Figures & data
Figure 1 Behavioral test area in sheep. (A) Sheep in a stanchion. The sheep was able to move forward and backward within the limited space of the stanchion. The testing area (circled in red) is located below the patella and above the tuber calcanei. (B) Cutaneous innervation of the test area.
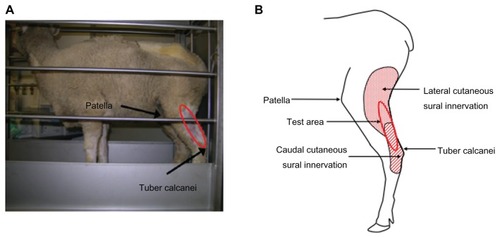
Figure 2 Sheep hindlimb withdrawal thresholds.
Abbreviations: ANOVA, analysis of variance; PNI, peroneal nerve injury.
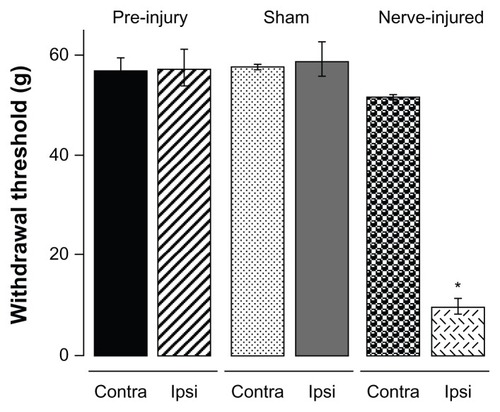
Figure 3 Development of prolonged allodynia after nerve injury. Hindlimb withdrawal thresholds were determined over the 8-week test period (n = 6). (A) Withdrawal thresholds of the contralateral hindlimb showed no significant difference in sham and PNI sheep. (B) Withdrawal thresholds of the ipsilateral hindlimb of PNI sheep were significantly reduced 3 days after nerve injury and remained reduced for the 8 weeks of the study.
Abbreviations: ANOVA, analysis of variance; PNI, peroneal nerve injury.
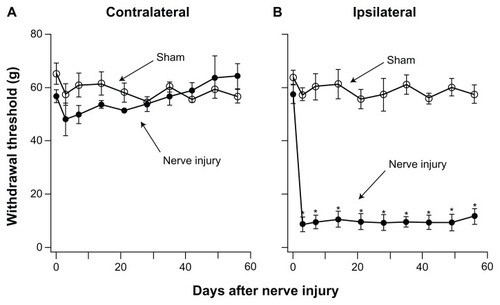
Figure 4 Time course of IT morphine effect.
Abbreviations: ANOVA, analysis of variance; IT, intrathecal.
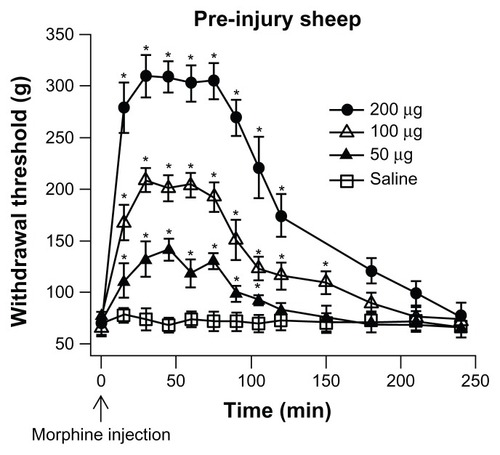
Figure 5 Dose-response of IT morphine on hindlimb withdrawal threshold. The hindlimb withdrawal threshold was determined 30 minutes after each IT dose of morphine. Each dose of morphine was given in 100 μL volume. Pre-injury sheep were tested 1–2 weeks before surgery. Sham and PNI sheep were tested 3 weeks after surgery. (A) Dose–response curve of pre-injury, sham, and nerve-injured contralateral hindlimbs. Dose–response curves were plotted as withdrawal threshold (g) versus cumulative morphine dose. The theoretical curves (solid lines) shown were fit to the contralateral nerve injured data with the Hill equation. The ED50 was determined from the fitted curve. The morphine ED50 for contralateral hindlimbs of pre-injury (73.4 μg), sham (74.8 μg), and nerve-injured sheep (88.3 μg) were not significantly different. (B) Dose–response curve of pre-injury, sham, and nerve-injured ipsilateral hindlimbs. The ipsilateral pre-injury curve was extrapolated to the x-axis limit. The theoretical curves (solid lines) shown were fit to the ipsilateral pre-injury and ipsilateral nerve-injured data with the Hill equation.
Abbreviations: ED50, the IT morphine dose that produces 50% of maximal analgesia; IT, intrathecal; PNI, peroneal nerve injury.
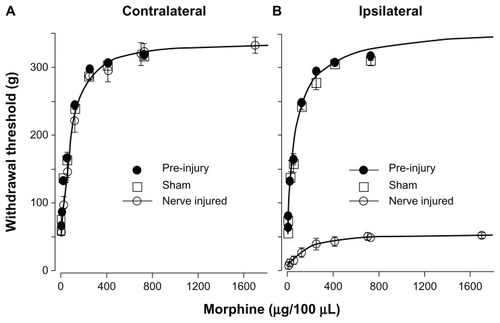
Table 1 IT morphine ceiling dose comparison