Figures & data
Figure 1 Flow chart for research selection strategy based on the Preferred Reporting Items for Systematic Reviews and Meta-Analyses (PRISMA) Statement.
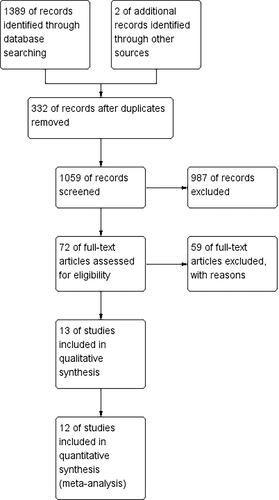
Table 1 Characteristics of Included Studies
Figure 2 Bias risk assessment for included studies.
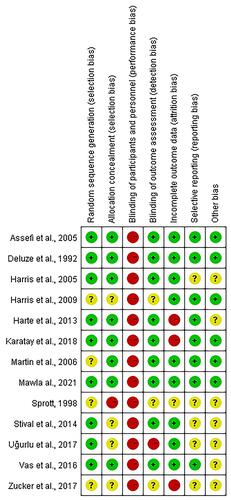
Table 2 Effect Sizes of Acupuncture Group Compared with Control Group on Selected Outcome Variables
Figure 3 Forest plots of the analgesic effect of acupuncture in the post-treatment. (A) Subgroup analysis: manual acupuncture vs electroacupuncture. (B) Subgroup analysis: individual adapted acupuncture vs standardized acupuncture. (C) Subgroup analysis: less than 10 sessions vs more than 10 sessions.
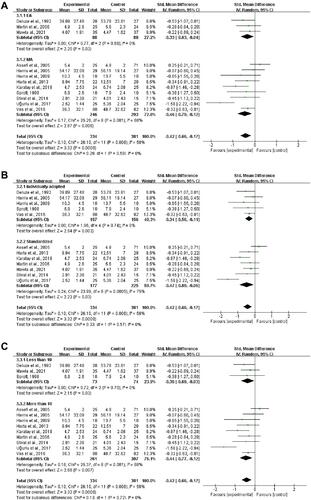
Figure 4 The forest plot of adverse events.
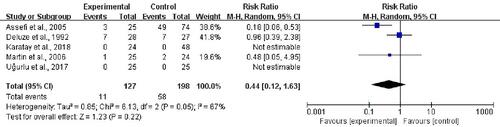
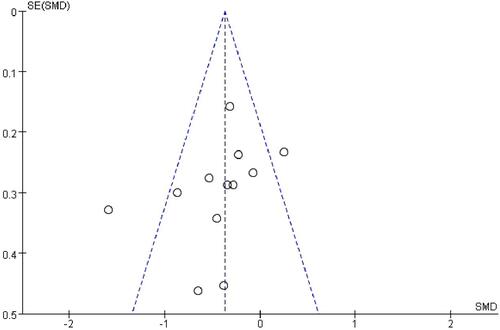
Figure 5 Publication bias funnel plots of standard errors and effect sizes of the included studies.