Figures & data
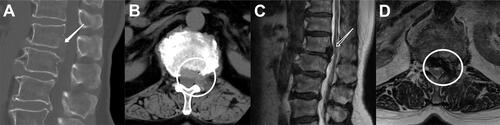
Figure 1 Flow chart of the study.
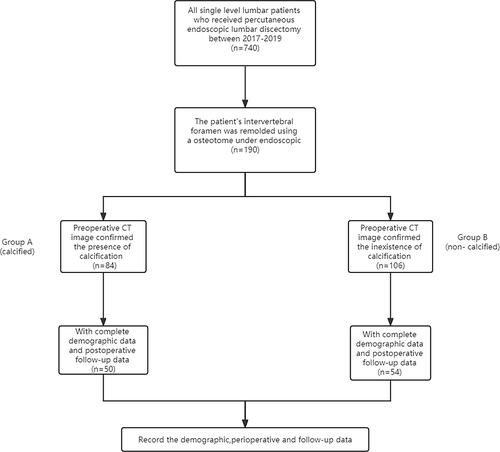
Table 1 Preoperative Demographic Characteristics
Figure 2 The patient’s position. The patient was placed in the lateral decubitus position after entering the operating room, whose Hip and knee were flexed, and a lumbar pillow was placed under the lesion to aid access to the intervertebral foramen. The height of normal saline stent is about 1.8m, and the height from the operating table is about 1m.
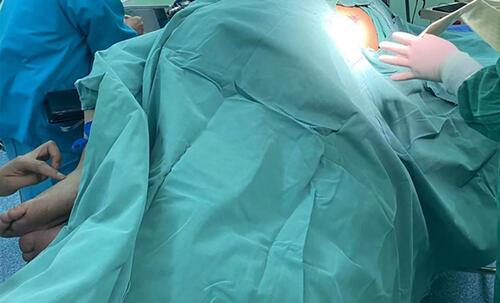
Figure 3 Intraoperative views. (A) The intervertebral foramen was remolded with a endoscopic osteotome. (B) After secondary molding, the calcified disc pressing on the nerve root was exposed. (C) Calcified discs were removed in fragments. (D) After decompression, the nerve roots showed good pulsation.
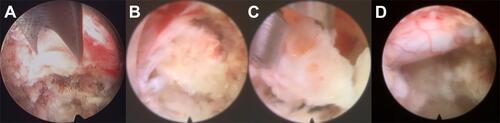
Table 2 Perioperative Outcomes
Table 3 The Preoperative and Postoperative NRS Data
Figure 4 ODI scores in groups A and B. Blue is group A, red is group B. The ODI score of group A was expressed as mean ± standard deviation. In the preoperative and postoperative 1 week, after 3 months, 6 months after operation, and postoperative 12 months were 67.4% ± 13.3%, 32.0%± 9.0%, and 20.4% ± 8.8%, 11.0% ± 6.3%, and 6.8% ± 5.2%. The ODI score of group B was expressed as mean ± standard deviation. In the preoperative and postoperative 1 week, after 3 months, 6 months after operation, and postoperative 12 months were 67.7%±14.4%, 31.1%±10.8%, 19.6%±7.8%, 10.7%±5.8%, 5.9%±5.4%.
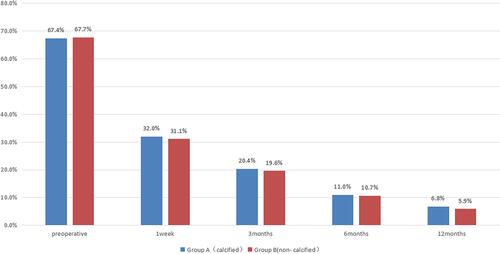
Figure 5 Modified Macnab criteria. (A) Modified Macnab criteria of group A. (B) Modified Macnab criteria of group B.
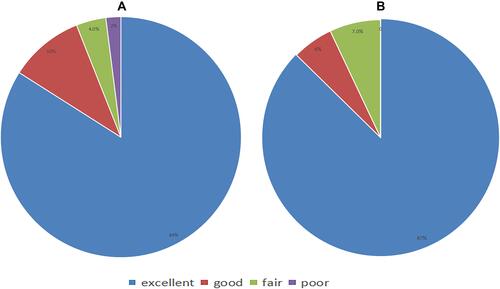
Figure 6 Preoperative CT and MRI images. Preoperative sagittal (A) and axial (B) views by computed tomography. Preoperative sagittal (C) and axial (D) views by magnetic resonance imaging. The calcified lumbar disc compression nerve is indicated by the white arrow and white circle. The patient was a 70-year-old woman with preoperative CT and MRI showing a calcified lumbar disc herniation with nerve compression.The white arrows and circles indicate the location of the calcification foci pressing on the nerve root.
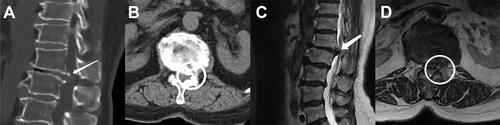
Figure 7 Postoperative CT and MRI images. Postoperative sagittal (A) and axial (B) views by computed tomography. Postoperative sagittal (C) and axial (D) views by magnetic resonance imaging. The position indicated by The white arrow and circle indicates that the vertebral margin to which the calcified lesion was attached was removed by casing rotation. The patient’s pain was improved after surgery compared with that before surgery, and the compression site obtained sufficient decompression.