
Figures & data
Figure 1 Femoral nerve blocking guided by ultrasound. Arrow indicates the femoral nerve, which is surrounded by injected ropivacaine.
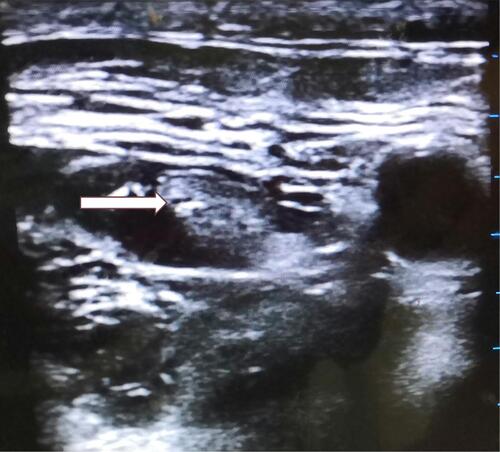
Figure 2 Flow diagram for the up-and-down method.
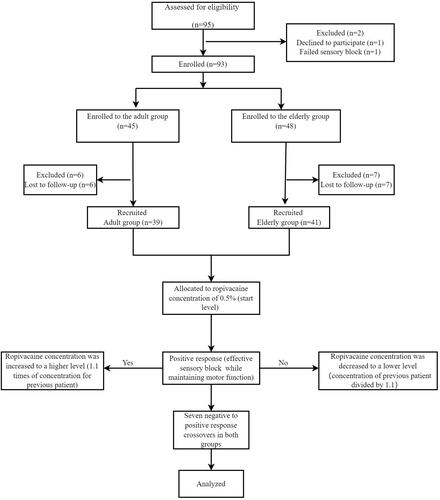
Table 1 Group Characteristics and Demographic Data
Figure 3 Femoral nerve block responses to predetermined ropivacaine concentrations using the Dixon’s up-and-down method in consecutive Group 1 (in black) and Group 2 (in grey) patients. Only patients from the first negative to positive response crossover in the 2 respective age groups were included. These sequential arrays included seven crossovers from negative to positive responses in 2 groups (Group 1, aged 18–60 years; Group 2, >60 years). Solid circle, negative response concentration; open circle, positive response concentration.
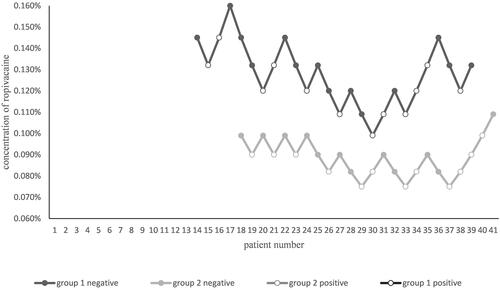
Table 2 Sensory Blockade Data
Table 3 Postoperative Analgesic Data in Differential Nerve Block