Figures & data
Figure 1 Study selection PRISMA flow diagram.
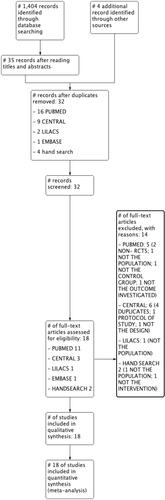
Table 1 Study Characteristics According to Population and Setting
Table 2 Study Characteristics Related to Description of Intervention, Control, and Outcomes
Table 3 Risk of Bias
Figure 2 Risk of bias according to different domains.
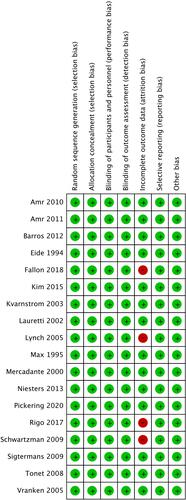
Figure 3 Meta-analysis on the overall mean pain reduction. Forest plot is representing the comparison of the overall mean pain between group ketamine and ST.
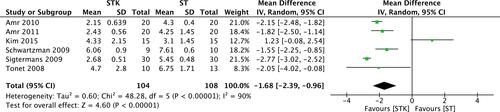
Table 4 GRADE Evidence Profile for Clinical Outcomes
Figure 4 Meta-analysis on the average mean pain reduction. Forest plot is representing the comparison of the mean pain between group ketamine and ST according to time after the end of treatment.
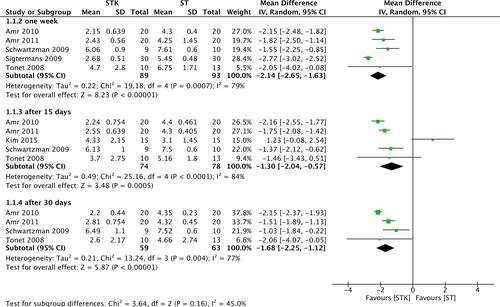
Figure 5 Meta-analysis on the average mean pain reduction over time. Forest plot is representing the comparison of the mean pain in the ketamine at different time points compared to baseline pain.
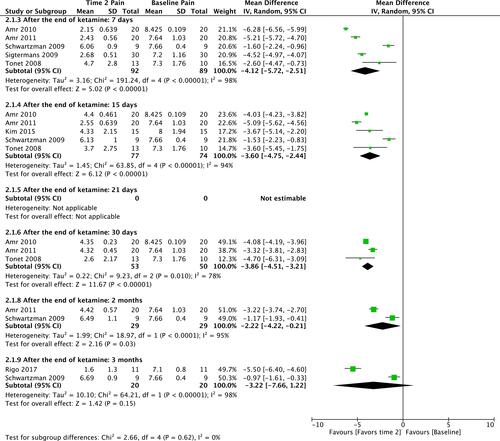
Figure 6 Meta-analysis on the average standardized mean pain reduction. Forest plot is representing the comparison of the mean pain between group ketamine and ST according to different multidimensional pain scales.
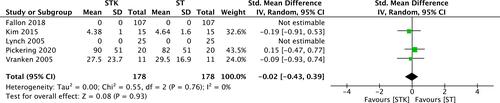
Figure 7 Meta-analyses on the incidence of adverse outcomes. Forest plot is representing the comparison between group ketamine and ST according to different adverse outcomes.
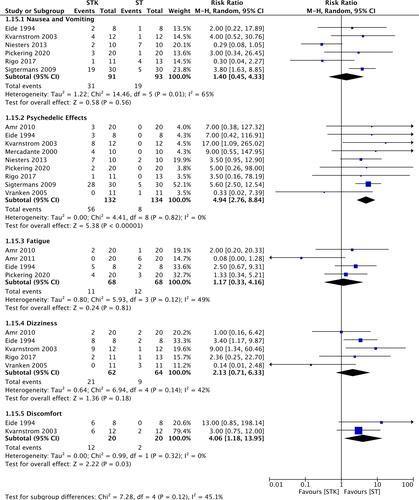
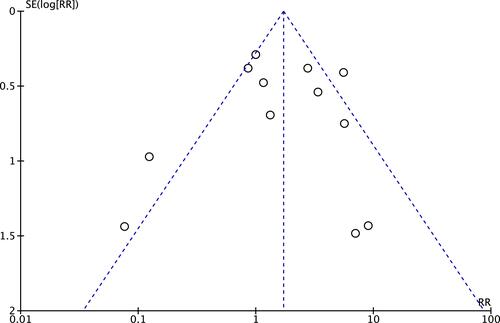
Figure 8 Publication bias. Funnel Plot representing the distribution of studies according to their results.