
Figures & data
Figure 1 PRISMA flowchart of the search and selection processes for included studies.
Notes: Adapted from: Liberati A, Altman DG, Tetzlaff J, et al. The PRISMA statement for reporting systematic reviews and meta-analyses of studies that evaluate healthcare interventions: explanation and elaboration. BMJ. 2009;339(jul21 1):b2700–b2700. doi:10.1136/bmj.b2700.Citation33 Copyright 2009 Liberati et al. Creative Commons.
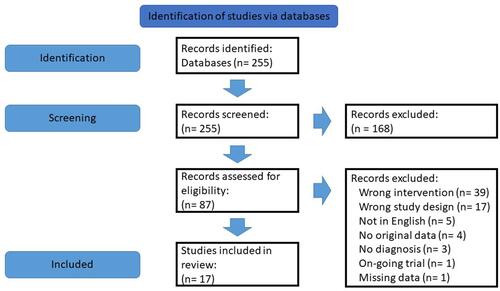
Figure 2 The distribution of primary and comorbid diagnoses of participants in the KAP studies included for review.
Abbreviations: ADHD, attention deficit hyperactivity disorder; BD, bipolar disorder; EDNOS, eating disorder not otherwise specified; GAD, generalized anxiety disorder; MDD, major depressive disorder; OCD, obsessive compulsive disorder; OIH, opioid-induced hyperalgesia; PTSD, posttraumatic stress disorder; SUD, substance use disorder.
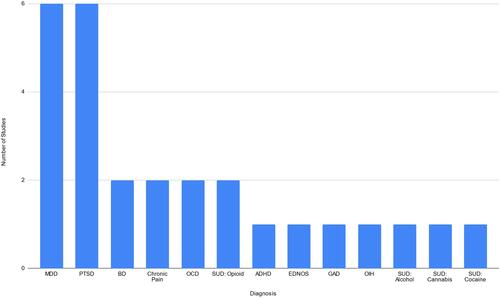
Table 1 Shows the Methods of Ketamine Administration
Figure 3 Frequency and route of ketamine administration.
Abbreviations: IM, intramuscular; IN, intranasal; IV, intravenous; SL, sublingual.
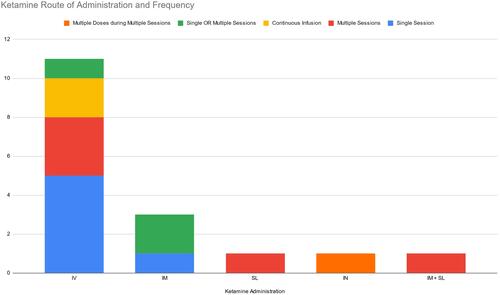
Table 2 Timing of Psychotherapy in Relation to Ketamine Administration