Figures & data
Figure 1 Study algorithm (the order of the tests in the baseline assessments are as listed in the table).
Abbreviations: CDT, cool detection threshold; EDT, electrical detection threshold; EPT, electrical pain threshold; EPTo, electrical pain tolerance; HPT, heat pain threshold; WDT, warmth detection threshold.
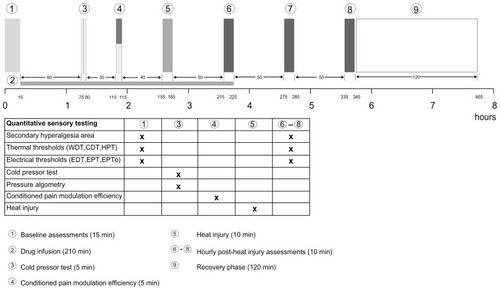
Figure 2 Participant flow-diagram.
Notes: Participant flow-diagram of the study illustrating patient enrollment, inclusion, the two study days and analysis. The intention-to-treat (ITT) and per-protocol (PP) groups were 33/33 (females/males) and 13/14, respectively.
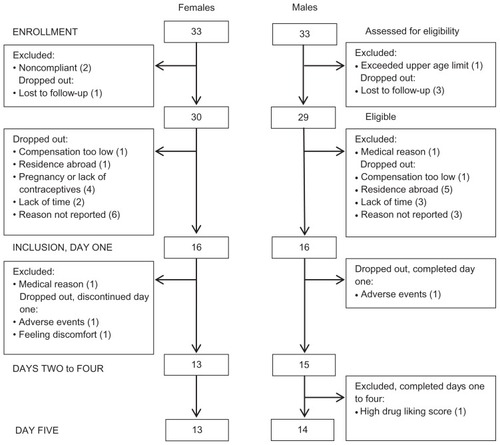
Figure 3 CPM-efficiency.
Notes: The conditioned pain modulation (CPM) efficiency with repeated phasic heat stimuli (47°C, 4 s [1,3,4,5]) in relation to submersion of the non-dominant hand (2) in the cold pressor test (CPT [0.3°C–0.5°C, 30 s]). During the phasic heat stimuli, the subjects rated their maximal pain on a visual analog scale (VAS [0–10]).
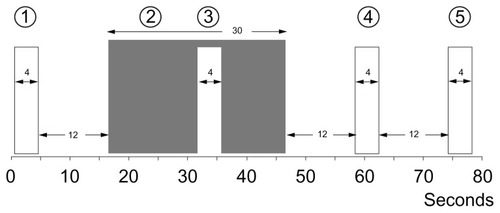
Table 1 Anthropometric data
Figure 4 Drug effect and drug like.
Note: Drug effect and drug like scores for placebo, morphine and buprenorphine (low- and high-doses). *P < 0.005, **P < 0.001, ***P < 0.0001.
Abbreviations: DE, drug effect; DL, drug like.
Abbreviations: DE, drug effect; DL, drug like.
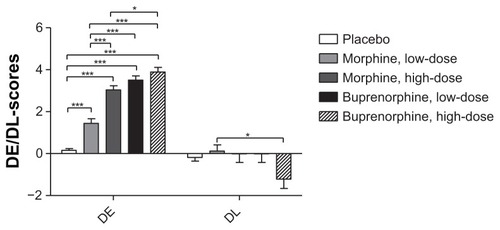
Table 2 Tests affected by floor or ceiling values
Table 3 Baseline comparisons
Figure 5 Electrical pain threshold and electrical pain tolerance.
Notes: Electrical pain threshold and electrical pain tolerance for baseline, postburn 1–3 assessments and mean postburn assessments. The asterisks on baseline values indicates differences between baseline and its respective mean postburn value, while asterisks on mean postburn values indicate differences between the five sessions mean postburn assessments.
Abbreviations: EPT, Electrical pain threshold; EPTo, electrical pain tolerance; Mean PB, mean of PB1, PB2 and PB3; PB1, 1 hour postburn; PB2, 2 hours postburn; PB3, 3 hours postburn.
Abbreviations: EPT, Electrical pain threshold; EPTo, electrical pain tolerance; Mean PB, mean of PB1, PB2 and PB3; PB1, 1 hour postburn; PB2, 2 hours postburn; PB3, 3 hours postburn.
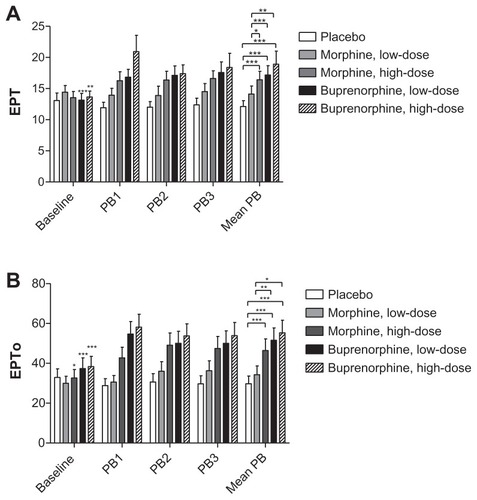
Figure 6 Cool detection threshold and heat pain threshold.
Notes: Cool Detection Threshold (CDT) and Heat Pain Threshold (HPT) for baseline, postburn 1–3 (PB1-3) and mean postburn (mean PB) assessments. The asterisks on baseline values indicate differences between baseline and its respective mean postburn value while asterisks on mean postburn values indicate differences between the five sessions mean postburn assessments.
Abbreviations: CDT, cool detection threshold; HPT, heat pain threshold; Mean PB, mean of PB1, PB2 and PB3; PB1, 1 hour postburn; PB2, 2 hours postburn; PB3, 3 hours postburn.
Abbreviations: CDT, cool detection threshold; HPT, heat pain threshold; Mean PB, mean of PB1, PB2 and PB3; PB1, 1 hour postburn; PB2, 2 hours postburn; PB3, 3 hours postburn.
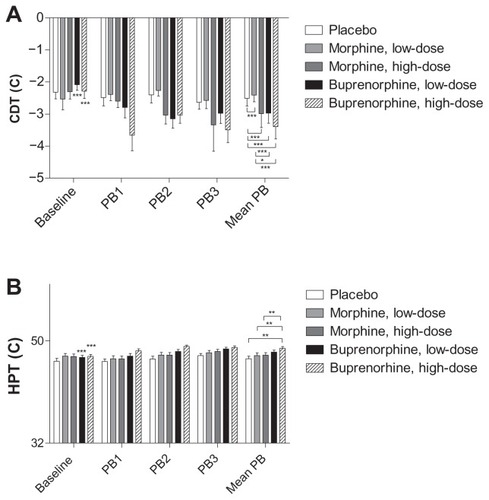
Figure 7 Accumulated visual analog scale scores during heat injury.
Notes: Accumulated VAS scores [0–10] during the heat injury. *P < 0.005, **P < 0.001, ***P < 0.0001.
Abbreviation: VAS, visual analog scale.
Abbreviation: VAS, visual analog scale.
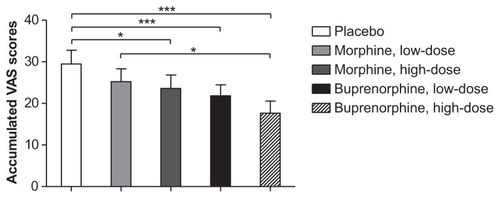
Figure 8 Pressure algometry.
Notes: Pressure pain tolerance before and after the cold pressor test, and delta pressure pain tolerance. *P < 0.005, **P < 0.001, ***P < 0.0001.
Abbreviations: PTo1, pressure pain tolerance before CPT; PTo2, pressure pain tolerance after CPT; ΔPTo = PTo2 – PTo1.
Abbreviations: PTo1, pressure pain tolerance before CPT; PTo2, pressure pain tolerance after CPT; ΔPTo = PTo2 – PTo1.
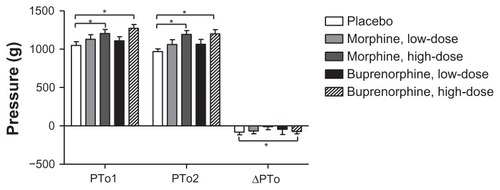
Figure 9 Cold pressor test.
Notes: Cold pressor test with registration of cold pressor pain and cold pressor tolerance. *P < 0.005, **P < 0.001, ***P < 0.0001.
Abbreviations: CPP, cold pressor pain; CPT, cold pressor test; CPTo, cold pressor tolerance.
Abbreviations: CPP, cold pressor pain; CPT, cold pressor test; CPTo, cold pressor tolerance.
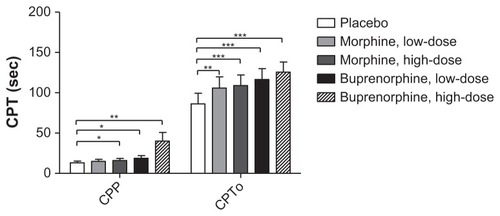
Figure 10 Conditioned pain modulation.
Notes: Visual analog scale scores (0–10) during the test for CPM-efficiency. (Statistics only performed on ΔCPM). *P < 0.005, **P < 0.001, ***P < 0.0001.
Abbreviations: CPM1, conditioned pain modulation rating before the cold pressor test; CPM2, conditioned pain modulation rating during the cold pressor test; CPM3, conditioned pain modulation rating 12 seconds after the cold pressor test; CPM4, conditioned pain modulation rating 24 seconds after the cold pressor test; ΔCPM, conditioned pain modulation efficiency; VAS, visual analog scale.
Abbreviations: CPM1, conditioned pain modulation rating before the cold pressor test; CPM2, conditioned pain modulation rating during the cold pressor test; CPM3, conditioned pain modulation rating 12 seconds after the cold pressor test; CPM4, conditioned pain modulation rating 24 seconds after the cold pressor test; ΔCPM, conditioned pain modulation efficiency; VAS, visual analog scale.
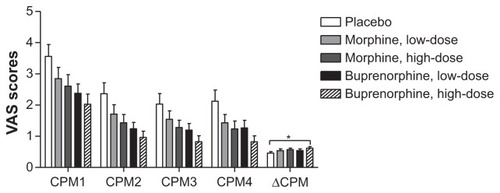
Figure 11 Secondary hyperalgesia areas.
Note: Secondary hyperalgesia areas, in the three postburn assessments (PB1-3) and mean postburn values.
Abbreviations: Mean PB, mean of PB1, PB2 and PB3; PB1, 1 hour postburn; PB2, 2 hours postburn; PB3, 3 hours postburn.
Abbreviations: Mean PB, mean of PB1, PB2 and PB3; PB1, 1 hour postburn; PB2, 2 hours postburn; PB3, 3 hours postburn.
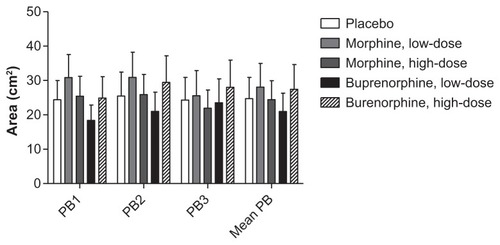
Figure 12 Anti-hyperalgesia and analgesia.
Notes: Placebo-corrected differences for the active treatments in secondary hyperalgesia areas (Δ2HA[%], upper panel), pain-ratings during the heat injury (ΔPHI[%], middle panel), and electrical pain thresholds (ΔEPTo[%], lower panel). Columns are median (IQR). The anti-hyperalgesia/analgesia ratios (Δ2HA/ΔPHI and Δ2HA/ΔEPTo) for the four opioids relative to placebo.
Abbreviations: Δ2HA(%), secondary hyperalgesia area relative to placebo; ΔPHI(%), heat injury relative to placebo; ΔEPTo(%), electrical pain tolerance relative to placebo; 2HA/PHI, ratio (secondary hyperalgesia/heat injury) relative to placebo; 2HA/EPTo, ratio (secondary hyperalgesia/electrical pain tolerance) relative to placebo; IQR, inter-quartile range
Abbreviations: Δ2HA(%), secondary hyperalgesia area relative to placebo; ΔPHI(%), heat injury relative to placebo; ΔEPTo(%), electrical pain tolerance relative to placebo; 2HA/PHI, ratio (secondary hyperalgesia/heat injury) relative to placebo; 2HA/EPTo, ratio (secondary hyperalgesia/electrical pain tolerance) relative to placebo; IQR, inter-quartile range
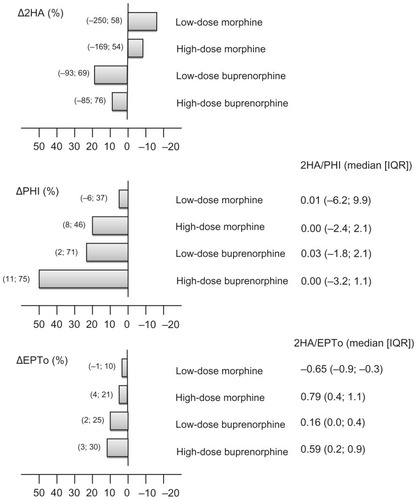
Table 4 Adverse events