Figures & data
Table 1 Patient Basic Information of Group PE-TLIF and Group MIS-TLIF
Figure 1 A case of PE-TLIF surgery.
Notes: (A and B) lumbar MRI revealed L4-5 lumbar disc herniation. (C) Frontal and (D) lateral X-ray images represented permanent positions after 3 months.
Abbreviations: PE-TLIF, percutaneous endoscopic transforaminal lumbar interbody fusion; MRI, magnetic resonance imaging.
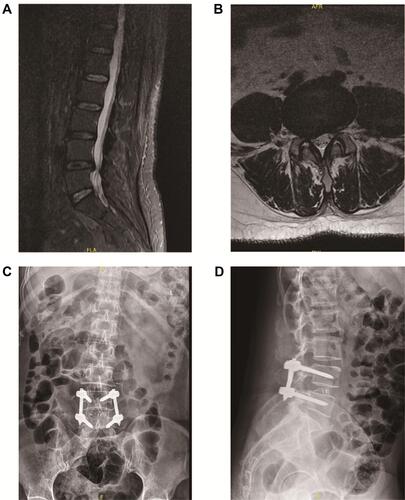
Figure 2 A case of MIS-TLIF surgery.
Notes: (A and B) lumbar MRI revealed L4-5 lumbar disc herniation. (C) Frontal and (D) lateral X-ray image represented permanent position after 3 months.
Abbreviations: MIS-TLIF, minimally invasive transforaminal lumbar interbody fusion; MRI, magnetic resonance imaging.
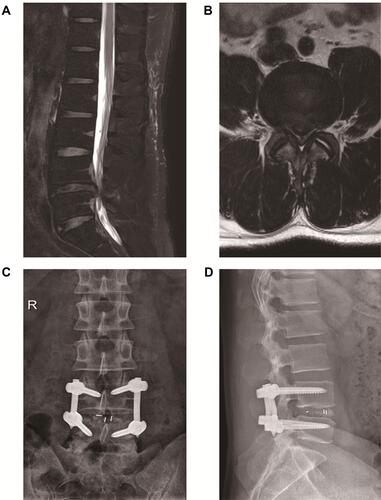
Table 2 Comparison of Serological Markers in Group PE-TLIF and Group MIS-TLIF
Table 3 Comparison of Clinical Outcomes Between PE-TLIF and MIS-TLIF
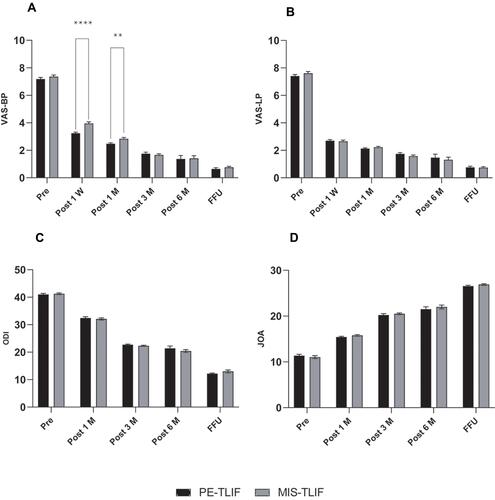
Figure 3 Comparison of (A) VAS back pain, (B) VAS leg pain, (C) ODI scores, and (D) JOA scores between the PE-TLIF and MIS-TLIF groups.
Notes: Pre, preoperative; Post 1 W, postoperative 1 week; Post 1 M, postoperative 1 month; Post 3 M, postoperative 3 months; Post 6 M, postoperative 6 months; FFU, Final Follow Up. Data are presented as mean ± SD. **P<0.01, ****P<0.0001 compared with MIS-TLIF group.
Abbreviations: VAS-BP, VAS back pain; VAS-LP, VAS leg pain; ODI, Oswestry disability index; JOA, Japanese Orthopaedic Association; PE-TLIF, percutaneous endoscopic transforaminal lumbar interbody fusion; MIS-TLIF, minimally invasive transformation lumbar interbody fusion.