Figures & data
Table 1 A Summary of Antibodies Used for Immunostaining
Table 2 Primers Used for RT-qPCR
Figure 1 Characteristics of cerium oxide nanoparticles (CONPs). (A–C) Transmission electron microscopy (TEM) image of CONPs. Arrows indicate the (111) and (200) lattice fringes with the interplanar spacing of 0.31 nm and 0.27 nm respectively. Scales = 10 nm (A), 50 nm (B) and 2 nm (C). (D) X-ray diffraction (XRD) pattern of CONPs. (E) Representative image of X-ray photoelectron spectroscopy (XPS) spectra of CONPs. (F) Dynamic light scattering (DLS) measurement of CONPs. (G) Summary of properties of CONPs.
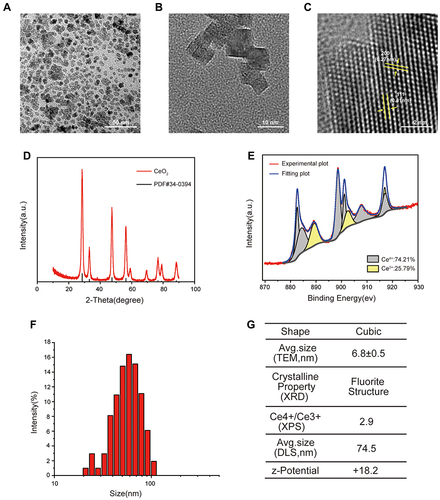
Figure 2 Effects of CONPs on macrophage viability and polarization. (A and B) Representative images (A) and statistical analysis (B) of live/dead staining showed a high concentration of CONPs treatment (800 μg/mL) can decrease the cell viability of macrophages (n = 5 each group). Scale bar = 100 μM. (C) Immunofluorescence analysis of macrophage phenotype distribution after CONPs treatment (n = 5 each group). M1 macrophages positive for CD86 (green) and M2 macrophages positive for Arg1 (red). Scale bar = 25 μM. The data were shown in mean ± standard deviation. P < 0.05 was set as significance. Compared with the control group, ***P < 0.001.
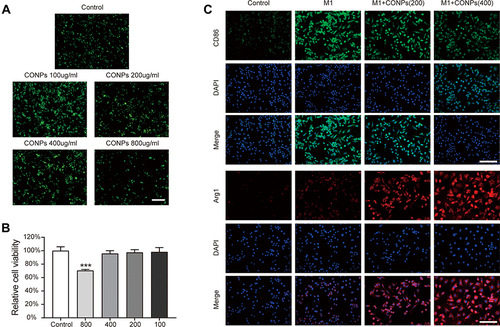
Figure 3 CONPs reduced neuropathic pain after SCI in vivo. (A) Motor function was assessed by BBB score after SCI (n = 40). (B and C) Pain responses to mechanical stimuli (B, PWT) and thermal stimuli (C, PWL) after SCI (n = 40). The SCI rats which developed neuropathic pain received CONPs injection on day 28 post-injury. (D–F) Intrathecal injection of CONPs significantly increased the motor function of SCI rats (D) and improved their pain responses to mechanical (E) and thermal (F) stimuli (n = 10 each group). The data were shown in mean ± standard deviation. P < 0.05 was set as significance. Compared with the sham or vehicle group, *p < 0.05.
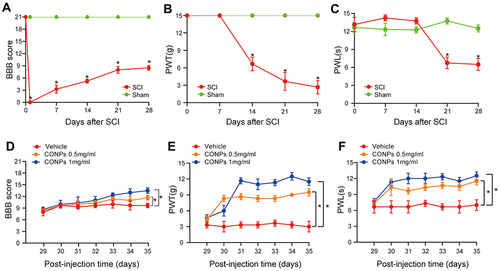
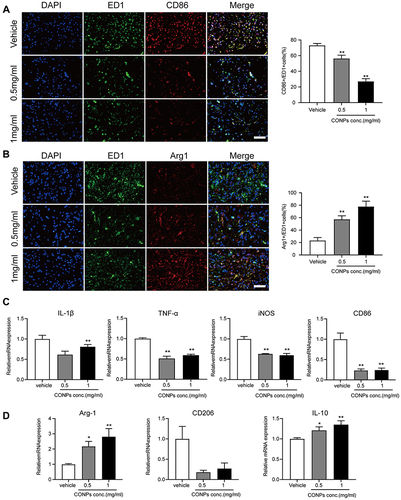
Figure 4 CONPs treatment promoted M2 macrophage polarization. (A and B) Representative immunofluorescence image of macrophage phenotype distribution after CONPs treatment (left, n = 12 each group). Scale bar = 50 μM. M1 macrophages positive for CD86 (red) and M2 macrophages positive for Arg1 (red). Cells were co-stained with pan macrophage markers (ED1, green). Statistical analysis showed CONPs injection significantly increased the percentage of Arg1+/ED1+ cells while decreasing that of CD68+/ED1+cells (right). (C) Gene expression analysis of M1-related markers by qRT-PCR (n = 5 each group). (D) Gene expression of M2-related markers by RT-qPCR (n = 5 each group). The data were shown in mean ± standard deviation. P < 0.05 was set as significance. Compared with the vehicle group, *P < 0.05, **P < 0.01.