
Figures & data
Figure 1 Flow chart of spinal cord stimulation procedure.
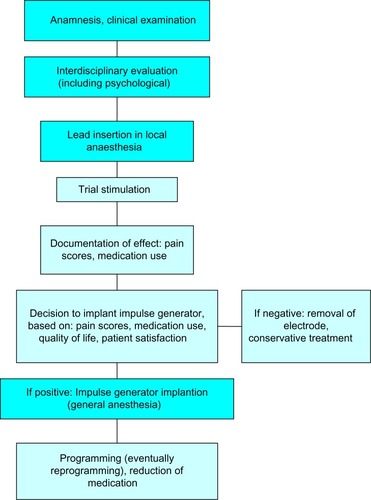
Figure 2 Anteroposterior and lateral view of a thoracolumbar spinal cord stimulation placement; the 8-pole lead (octrode) is positioned at level TH10–12, and the impulse generator is placed abdominally subcutaneously.
Abbreviations: R, right; L, left.
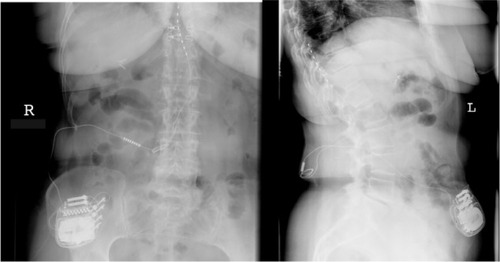
Figure 3 Anteroposterior and lateral view of a cervical spinal cord stimulation placement; the 8-pole lead (octrode) is positioned at level C3-5, and the spinal canal is entered at level TH2/3.
Abbreviation: R, right.
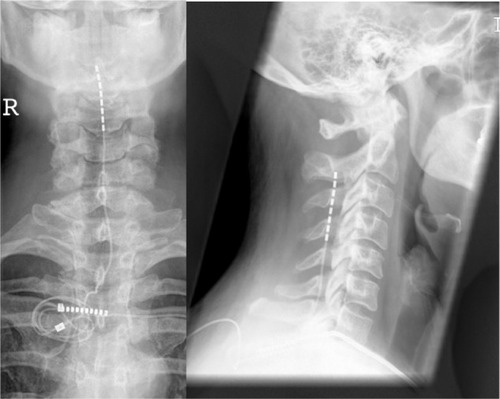
Table 1 Overview of indications and contraindications for spinal cord stimulation
Table 2 Overview of randomized studies for SCS (and PNFS)
Table 3 Possible complications of spinal cord stimulation