
Figures & data
Table 1 Patient Demographics and Clinical Characteristics
Table 2 Summary of Postoperative Outcomes
Figure 1 This STROBE flowchart shows patient inclusion.
Abbreviation: STROBE, Strengthening the Reporting of Observational studies in Epidemiology.
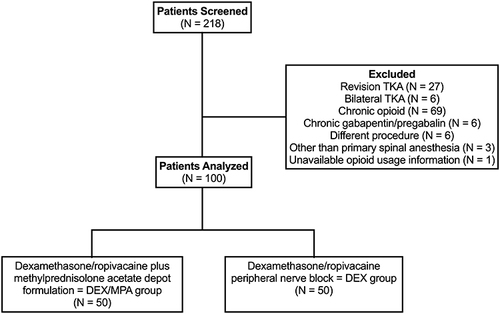
Figure 2 Progression of opioid consumption throughout the immediate postoperative period in DEX and DEX/MPA group.
Abbreviations: POD, postoperative day; OME, oral milligram morphine equivalent.
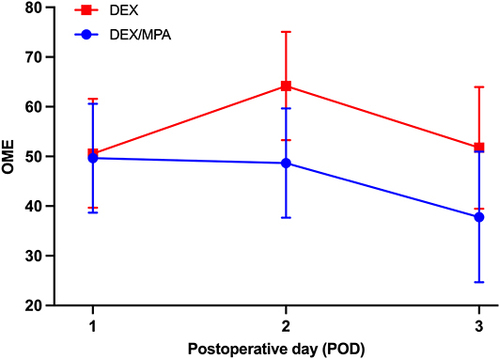
Table 3 Summary of Results for Laboratory Values