
Figures & data
Table 1 Demographic Data in Responder and Non-Responder Groups
Figure 1 PPT and TSP at the knee, tibia, and forearm in the responder (white) and non-responder groups (gray).
Notes: Significant differences between the groups were found for PPT at all measurement sites and TSP at the knee and tibialis anterior. No significant difference is observed in TSP at the extensor carpi radialis longus. *P<0.05; ***P<0.001.
Abbreviations: PPT, pressure pain threshold; TSP, temporal summation of pain; VAS, visual analog scale.
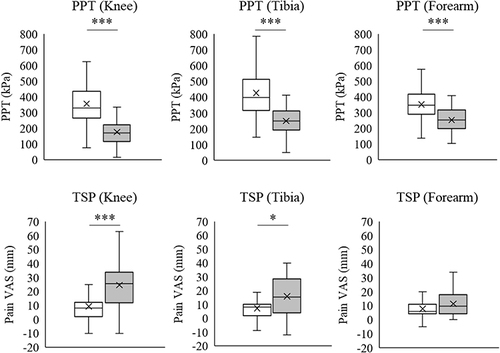
Table 2 AUC, Sensitivity, and Specificity for Recommended Cutoff Points