Figures & data
Figure 1 Flow chart for publications selection.
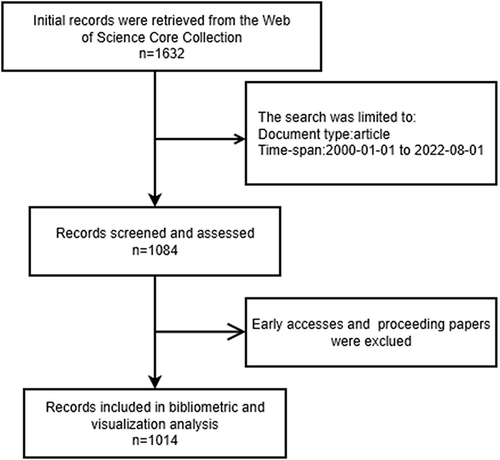
Figure 2 Trends of UCPPS publications over the past 22 years.
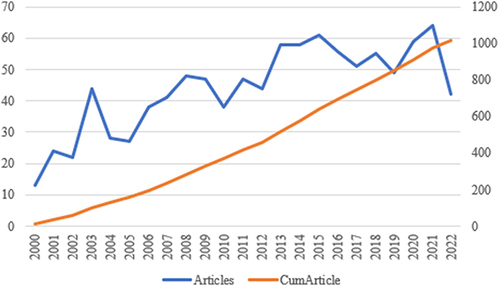
Figure 3 The top 10 most active countries/regions.
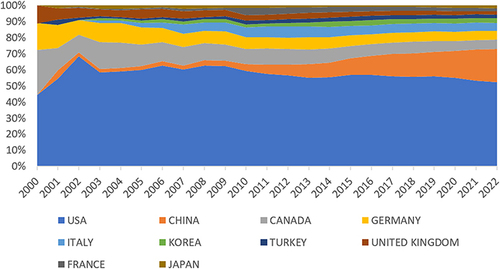
Table 1 Centrality of Inter-Country Cooperation
Figure 4 The co-authorship map of countries. The thickness of the connecting lines shows the frequency of cooperation, “total link strength” represents the number of papers produced by inter-country collaboration.
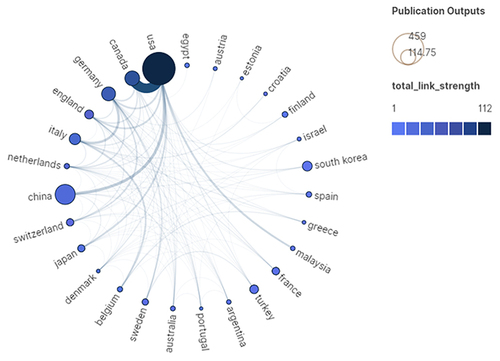
Table 2 Top 10 Authors Related to UCPPS
Figure 5 The co-authorship map of authors related to UCPPS. The size of the nodes indicates the number of documents published by the author in collaboration, and the thickness of the edges indicates the frequency of collaboration; the gradual change of color shows the passage of time.
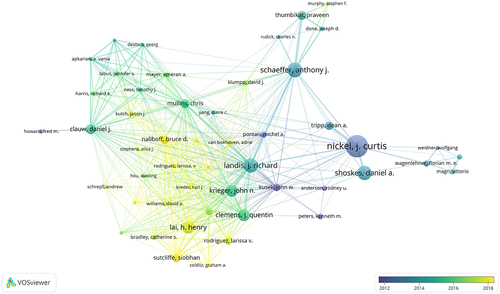
Figure 6 Journals clustering through Bradford’s law. According to Bradford’s Law, the logarithm of the number of ranked journals (Source log(rank)) is the horizontal coordinate, and the corresponding number of papers (Articles) is the vertical coordinate.
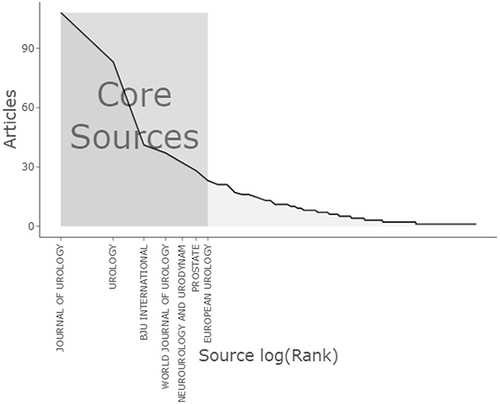
Table 3 Top 10 Journals Related to UCPPS
Table 4 Top 10 Co-Cited References Related to UCPPS
Figure 7 (A) The network of co-cited references. (B) The network of co-cited references clusters. Cluster size in graph (A) indicates the number of citations, reflecting the degree of attention the clusters have received. The size of the nodes in the graph (B) reflects the centrality of the article, centrality depicts the node establishing a bridge between 2 unrelated nodes, with a high mediated centrality highlighting the importance of the node in the knowledge structure.
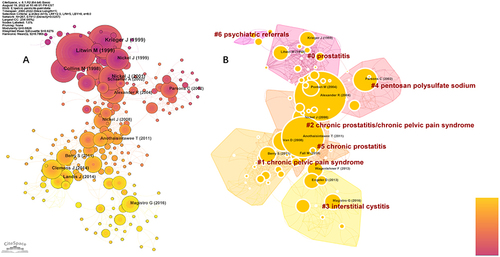
Figure 8 The dual-map overlay of journals on UCPPS. The dual-map overlay of journals demonstrated relationship distribution among journals, with citing journals on the left and cited journals on the right, and the colored paths between them suggesting the cited relationships.
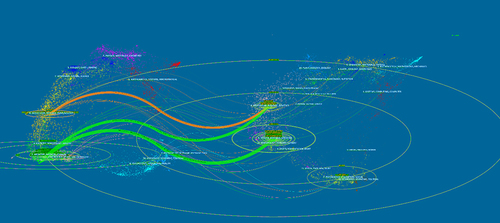
Figure 9 Map of keywords clustering analysis related to UCPPS. The circle nodes represent keywords and the connecting lines represent co-occurrence relationship, the larger the circle node, the more frequent the keyword appears and the more representative of the domain hotspot.
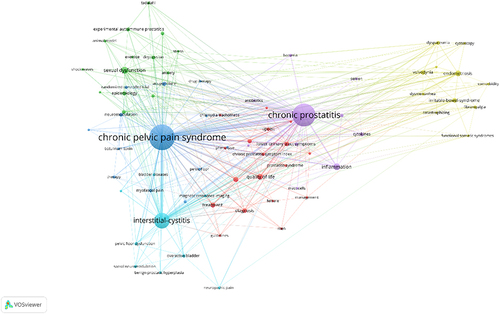
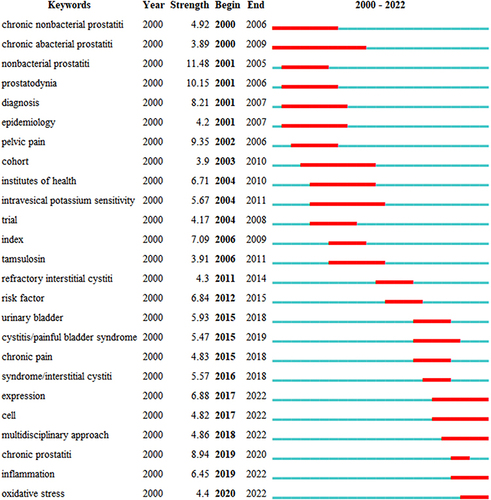
Figure 10 Top 25 Keywords with the Strongest Citation Bursts. The blue line indicates the time interval, while the red line indicates the time period when a keyword had a burst.