
Figures & data
Table 1 Most Common Comorbidities (Occurring in ≥10% of Any Lasmiditan Dose Group) by MedDRA Preferred Term (Safety Population)
Table 2 Incidence of TEAEs in Patients Who Reported Comorbiditiesa (Safety Population)
Figure 1 TEAE incidence: Forest plot of ORs (All LTN group vs PBO) for each of the most common comorbidity groups (safety population). Larger ORs indicate a higher incidence of TEAEs in the All LTN group compared with PBO. Dotted line indicates OR = 1. The interaction p-values shown are for the treatment-by-comorbidity interaction.
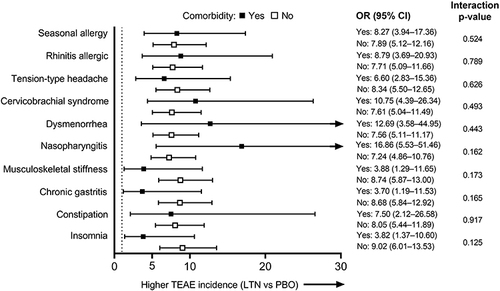
Figure 2 Efficacy: Forest plot of ORs (All LTN group vs PBO) for each of the most common comorbidity groups (mITT population). Larger ORs indicate a higher proportion of patients with pain freedom at 2 hours in the All LTN group compared with PBO. Dotted line indicates OR = 1.
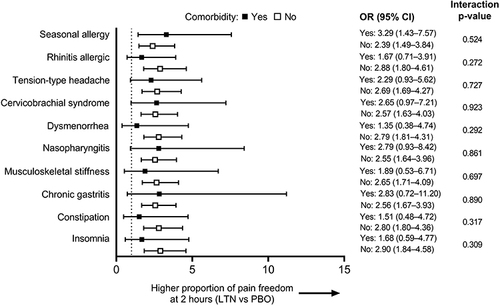
Table 3 Concomitant Medicationa Groups of Special Interest (Safety Population)
Figure 3 Most common TEAEs (≥5% in the All LTN group) in the MONONOFU studyCitation11 and their incidence in the concomitant medication groups (safety population).
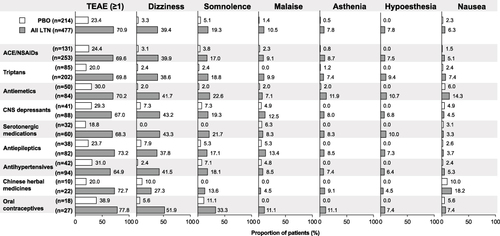
Figure 4 TEAE incidence: Forest plot of ORs (All LTN group vs PBO) for each of the concomitant medication groups (safety population). Larger ORs indicate a higher incidence of TEAEs in the All LTN group compared with PBO. Dotted line indicates OR = 1. The interaction p-values shown are for the treatment-by-concomitant medication interaction. Bold indicates concomitant medication groups and plain type indicates subgroups.
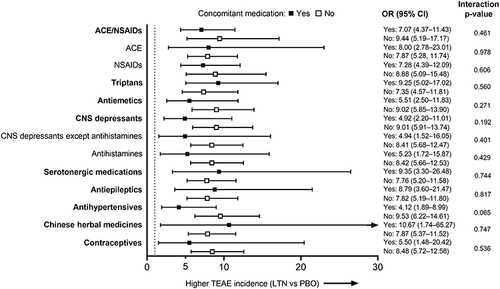
Table 4 Occurrence of Special Interest TEAEsa with and without CNS Depressant Use (Safety Population)
Table 5 Occurrence of Special Interest TEAEsa with or without Triptan or Serotonergic Medication Use (Safety Population)
Table 6 Occurrence of Special Interest TEAEsa with and without Antiemetic Medication Use (Safety Population)
Table 7 Occurrence of Special Interest TEAEsa with and without Antihypertensive Medication Use (Safety Population)