
Figures & data
Figure 1 Representative images of power Doppler (PD) ultrasonography. The left and right images show PD grade 1 and grade 2 synovitis, respectively.
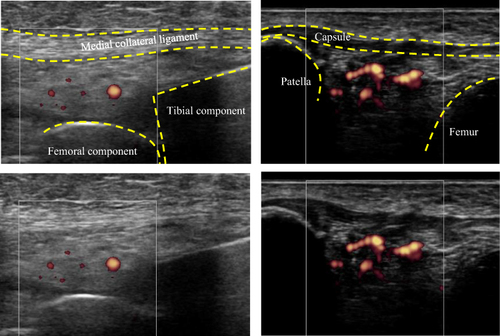
Figure 2 The knee joint was divided into the following 15 areas with grid lines for knee-synovitis mapping: 1) superomedial, 2) inferomedial, 3) supra, 4) superolateral, and 5) inferolateral patellofemoral joints; 6) suprapatellar pouch; 7) anteromedial, 8) posteromedial, 9) anterolateral, and 10) posterolateral tibial plateaus; 11) anteromedial, 12) posteromedial, 13) anterolateral, and 14) posterolateral femoral condyles; and 15) posterior patellar tendon.
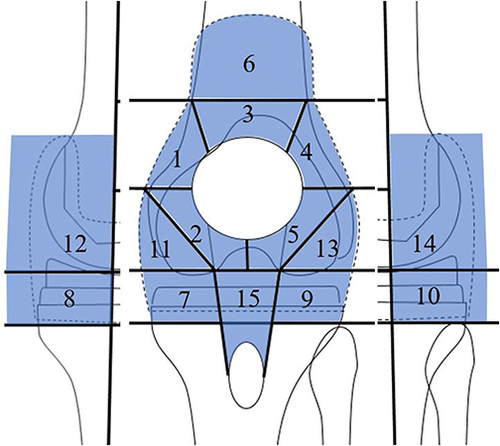
Figure 3 Radiographical evaluation. Femoro-tibial angle, α° (coronal femoral angle), β° (coronal tibial angle), γ° (sagittal femoral flexion angle), δ° (sagittal tibial posterior slope angle), and patellar tilting angle.
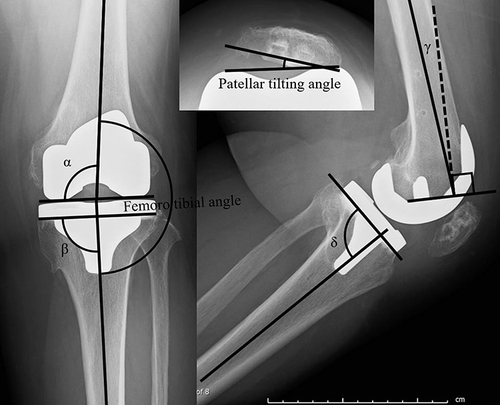
Table 1 Patient Demographic Data (N = 85)
Figure 4 Synovitis mapping. The percentage of synovitis is shown.
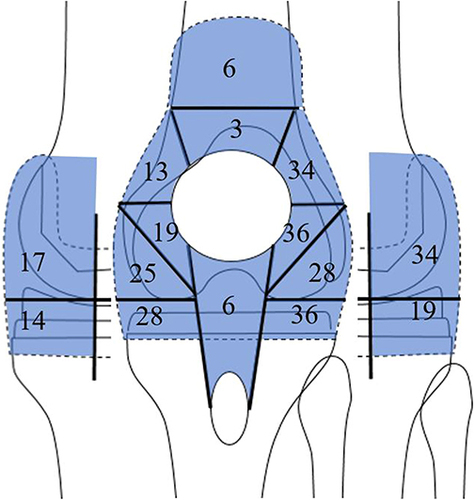
Table 2 Clinical, Radiographical, and Ultrasonographic Evaluation
Table 3 Correlation with WOMAC Pain Subscale
Figure 5 Pressure pain thresholds (PPTs) at power Doppler (PD) positive sites. Asterisks (*) indicate p value 0.01 compared with grade zero. Grade 0: G0, Grade 1: G1, Grade 2: G2.
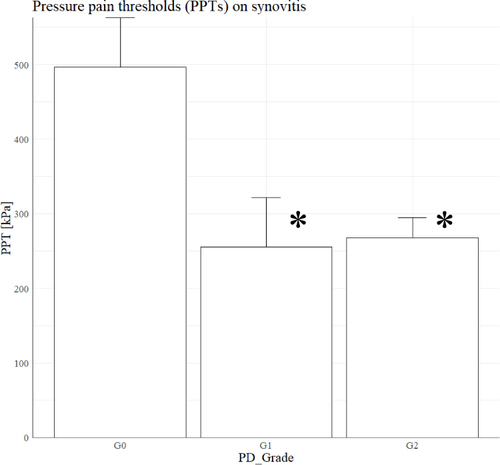
Table 4 Correlation with Total PD Score