Figures & data
Table 1 The Comparison of Clinical Data Between Herpes Zoster Patients (HZ) and Control Group (NC). Data Were Presented as mean±SD and the Significance Was Analyzed by Chi-Square Test
Table 2 Primers Sequences and the Size of Amplified Fragments for Toll-Like Receptors
Figure 1 The T lymphocytes in herpes zoster patients (HZ) and control groups (NC). (a) CD3+ T cells; (b) CD4+ T cells; (c) CD8+ T cells; (d) CD4+/CD8+ T cell ratio. Data were presented as mean±SD and the significance was analyzed by Student’s t-test, nsP>0.05, **P<0.01, ***P<0.001.
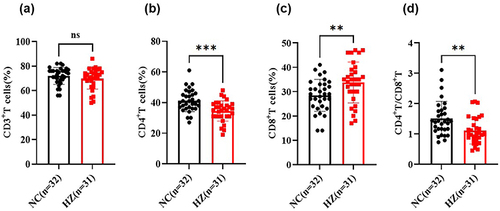
Figure 2 The T lymphocyte subsets in herpes zoster patients (HZ) and control groups (NC). (a) Th1, Th2, Th17 and Treg cells percentage in HZ and control groups; (b) Th1/Th2 and Th17/Treg cell ratio. Data were presented as mean±SD and the significance was analyzed by Student’s t-test, nsP>0.05, *P<0.05, **P<0.01.
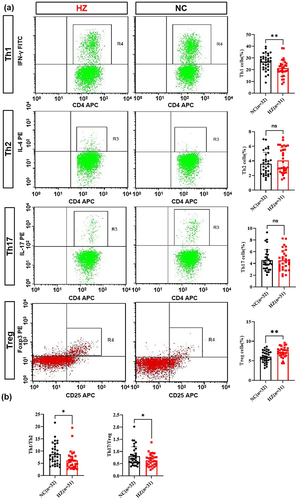
Figure 3 The cytokines in the serum of herpes zoster patients (HZ) and control groups (NC), including IL-2 (a), IL-4 (b), IL-6 (c), IL-10 (d), IL-17A (e), and IFN-γ (f). Data were presented as mean±SD and the significance was analyzed by Student’s t-test, nsP>0.05, *P<0.05, **P<0.01, ***P<0.001.
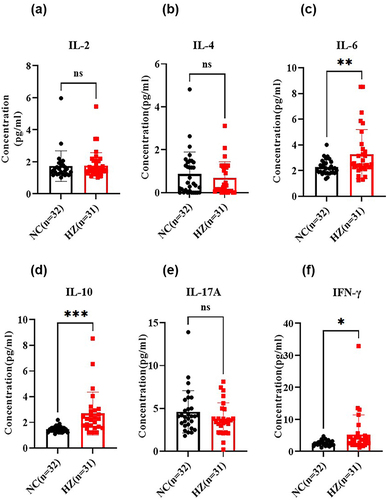
Figure 4 The mRNA expression of toll-like receptors in herpes zoster patients (HZ) and control groups (NC), including TLR2 (a), TLR4 (b), TLR7 (c), and TLR9 (d). Data were presented as mean±SD and the significance was analyzed by Student’s t-test, *P<0.05, **P<0.01.
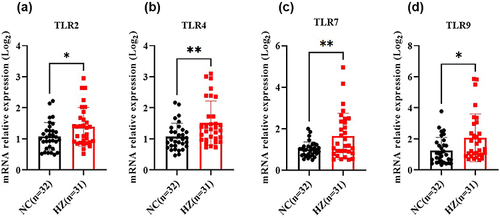
Figure 5 The protein expression of toll-like receptors in herpes zoster patients (HZ) and control groups (NC). The Flow cytometry method to detected TLRs (a) and TLRs expression in HZ patients and healthy control (b). Data were presented as mean±SD and the significance was analyzed by Student’s t-test, *P<0.05, **P<0.01, ****P<0.0001.
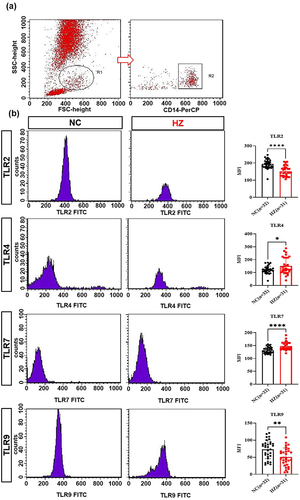
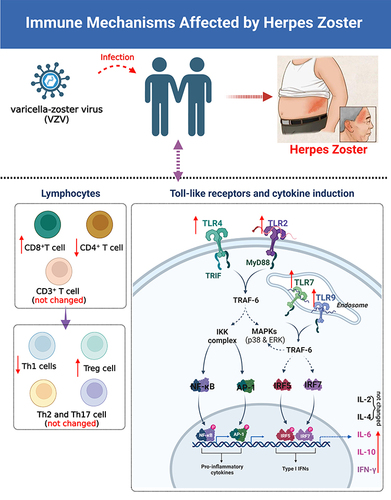
Figure 6 Summarized immune mechanisms affected by herpes zoster (HZ). Created with BioRender.com.