Figures & data
Figure 1 Overview of data available for each measure.
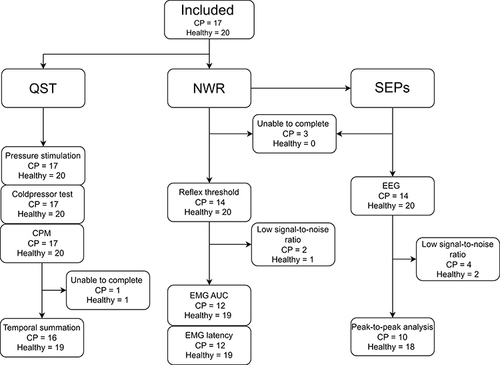
Table 1 Basic Demography of Included Chronic Pancreatitis Patients (n = 17) and Healthy Controls (n = 20)
Figure 2 (A) Median pain detection thresholds in patients with chronic pancreatitis (n = 17) and healthy controls (n = 20), Whiskers mark interquartile range, (B) Median pain tolerance thresholds in patients with chronic pancreatitis (n = 17) and healthy controls (n = 20), Whiskers mark interquartile range.
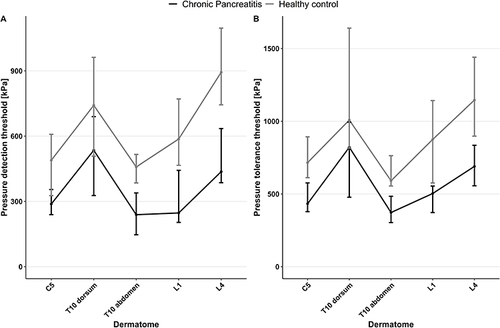
Figure 3 (A) Self-reported pain during cold pressor test in chronic pancreatitis patients (n = 17) and healthy controls (n = 20), VAS = visual analogue scale, (B) Coldpressor endurance time in chronic pancreatitis patients (n = 17) and healthy controls (n = 20).
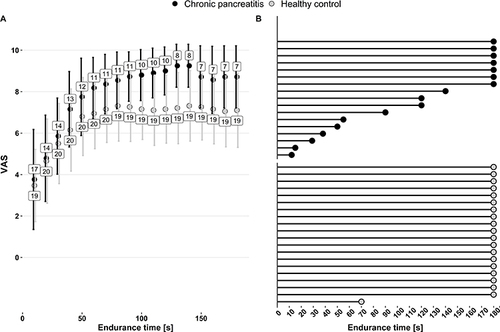
Figure 4 (A) Boxplot of reflex thresholds measured in mA during the nociceptive withdrawal reflex in patients with chronic pancreatitis (n = 14) and healthy controls (n = 20), (B) Boxplot of reflex AUC per subject measured using electromyography during elicitation of the nociceptive withdrawal reflex in patients with chronic pancreatitis (n = 12) and healthy controls (n = 19).
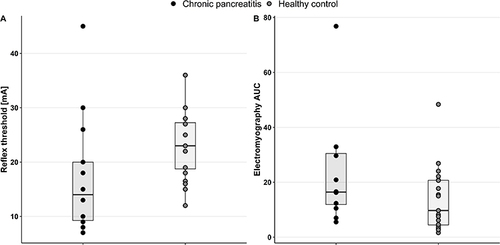
Table 2 Correlations Between Nociceptive Withdrawal Reflex Findings (Reflex Threshold, Reflex Area Under the Curve), Clinical Characteristics and Quantitative Sensory Testing Measures in Patients with Painful CPa
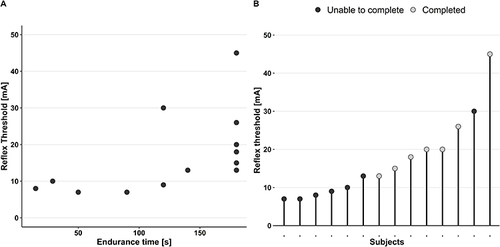
Figure 5 (A) Scatterplot of reflex thresholds and cold pressor endurance time in patients with painful chronic pancreatitis (n=14), (B) Reflex thresholds in patients with painful chronic pancreatitis colored according to whether they were able to endure the cold pressor test for 180 seconds (n=7) or less (n=7).