Figures & data
Figure 1 Search Flow Chart.
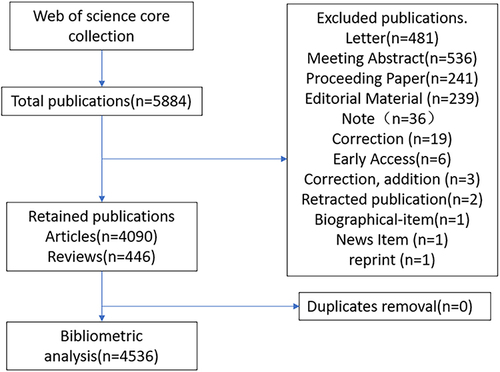
Table 1 Ranking of the Number of Articles Issued by Different Countries
Figure 2 Statistical chart of the top 20 countries in terms of number of articles published on analgesia in childbirth.
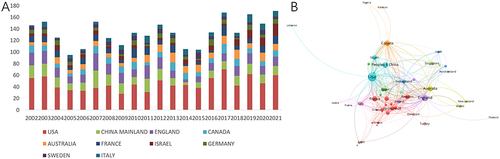
Table 2 Ranking of the 20 Institutions with the Highest Number of Publications
Figure 3 For labor analgesia without using the partnership map between institutions.
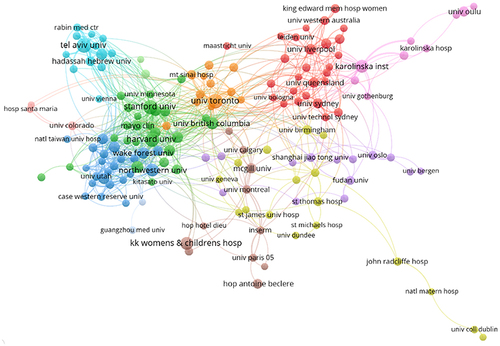
Figure 4 Distribution of articles published on labor analgesia in different disciplines.
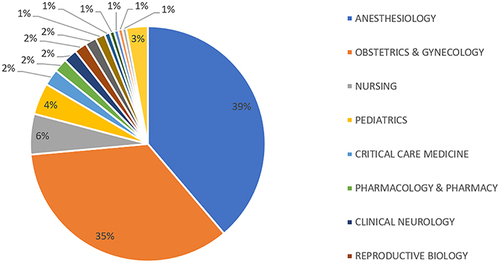
Table 3 The 10 Most Funded Funds and Recipient Institutions for Articles on Labor Analgesia
Table 4 Names of the Top 20 Journals in Terms of Number of Articles Published and Their Number of Articles Published
Figure 5 Annual distribution of articles on labor analgesia published in different journals.
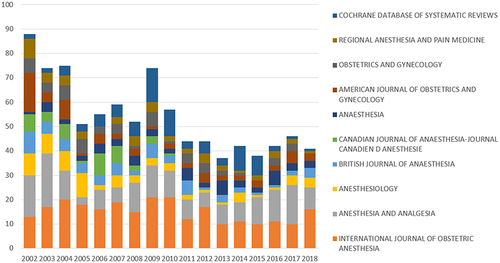
Table 5 Information on the Top 20 Cited Articles
Figure 6 Types of articles with the top 20 citations for labor analgesia.
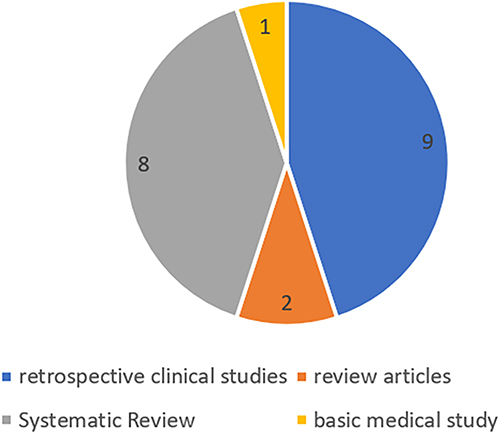
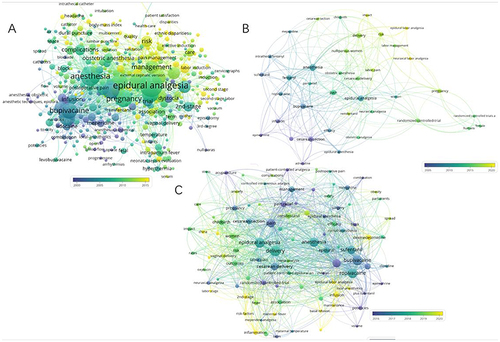
Figure 7 Hotspots of research on labor analgesia in the United States, Japan and China in recent years.