
Figures & data
Table 1 Search Strategy in PubMed
Figure 1 Flow diagram of study selection process.
Abbreviations: CNKI, China National Knowledge Infrastructure; VIP, VIP Database for Chinese Technical Periodical; Sino Med, Chinese biomedical literature service system.
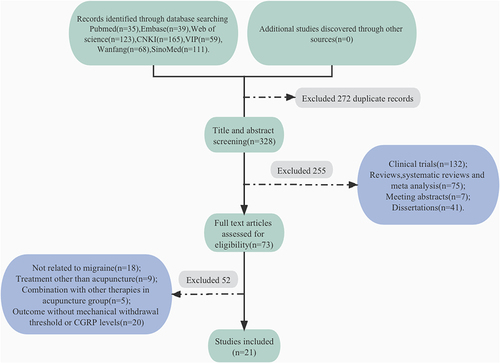
Table 2 Characteristics of the 21 Included Studies
Figure 2 Characteristics of the 21 included studies.
Notes: (A) Schematic diagram of the proportion of different animal models in the included article. (B) Number of different acupoints selected for the treatment of migraine model animals in the included articles. (C) The proportion of combinations of different acupoints in the included articles. (D) Statistics on the number of times different outcomes were used in the included articles. (E) The duration of treatment compared between included articles. (F) The duration of a single treatment compared between included articles.
Abbreviations: FMWT, facial mechanical withdrawal threshold; PMWT, paw mechanical withdrawal threshold; 50% FMWT, 50% facial mechanical withdrawal threshold; 50% PMWT, 50% paw mechanical withdrawal threshold; GB8, Shuaigu; LR3, Taichong; PC6, Neiguan; DU20, Baihui; SJ5, Waiguan; GB34, Yanglignquan; GB20, Fengchi.
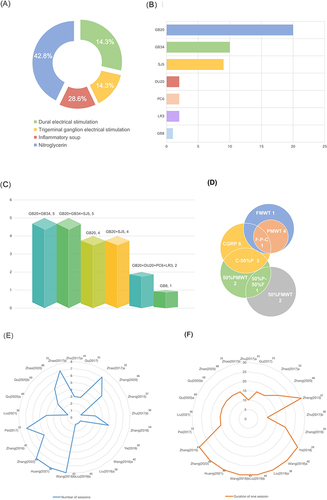
Table 3 Risk of Bias Assessment According to the Systematic Review Centre for Laboratory Animal Experimentation (SYRCLE) Tool
Table 4 Quality Assessment of Included Studies
Figure 3 Results of meta-analysis.
Notes: Pool results of acupuncture-treated migraine model rats versus migraine model rats on (A) FMWT, (B) PMWT, (C) 50% FMWT, (D) 50% PMWT and (E) CGRP; and the results of migraine model rats treated with sham-acupuncture on (F) FMWT, (G) PMWT, (H) 50% FMWT and (I) 50% PMWT.
Abbreviations: WMD, weighted mean difference; SMD, standard mean difference.
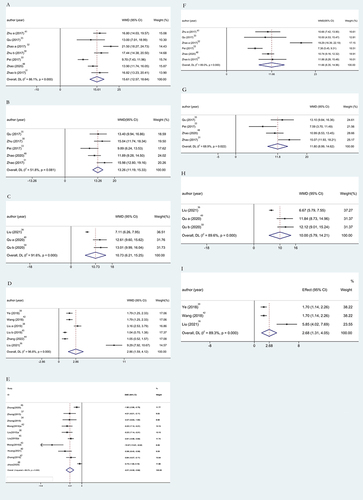
Table 5 Potential Mechanism of Included Studies