Figures & data
Table 1 Demographic Data and Clinical Characteristics of the LBLP and HC Groups
Table 2 Brain Regions with Altered Amygdala Functional Connectivity of LBLP and LBLP Subgroups (Voxel-Level P < 0.01, GRF Correction at Cluster-Level P < 0.05)
Figure 1 Altered connectivity of the left (A) and right (B) amygdala in LBLP patients (voxel-level P < 0.01, GRF correction at cluster-level P < 0.05).
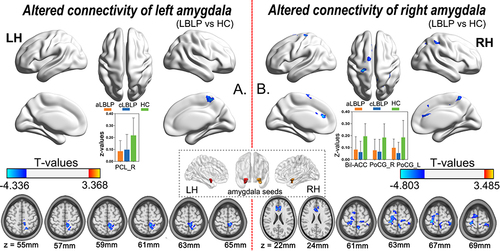
Figure 2 Altered pattern of amygdala rsFC in aLBLP and cLBLP patients (voxel-level P < 0.01, GRF correction at cluster-level P < 0.05).
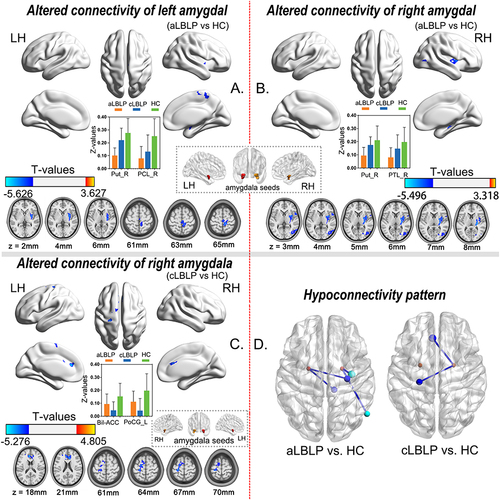
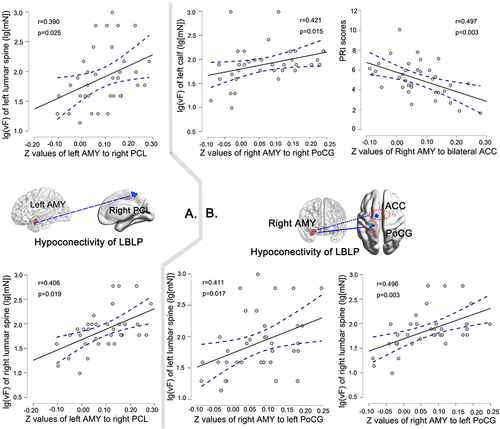
Figure 3 Spearman correlational analysis between decreased rsFC of left amygdala (A) and right amygdala (B) and lg-transformed vF test values (lg(vF)), or partial correlational analysis between decreased rsFC of right amygdala (B) and the PRI scores in LBLP patients.