Figures & data
Figure 1 The Hemor-Rite® cryotherapy device (Med-Rite Laboratories, Dallas, TX, USA).
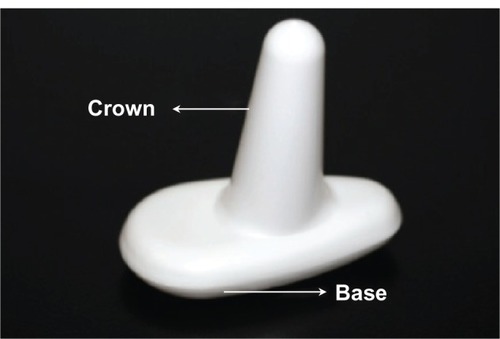
Figure 2 Day-by-day pain comparison of the various treatments used.
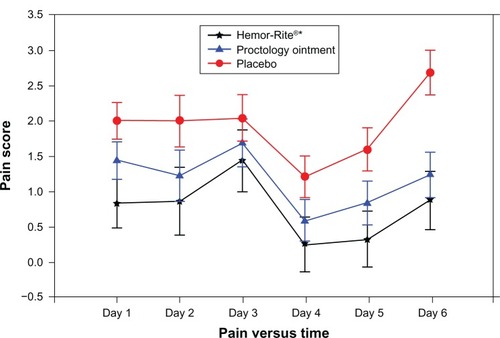
Figure 3 Day-by-day pain comparison of the different treatments used in the three applications per day.
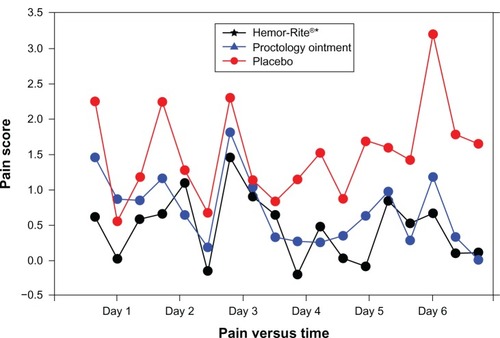
Figure 4 Final pain score for the three treatment alternatives.
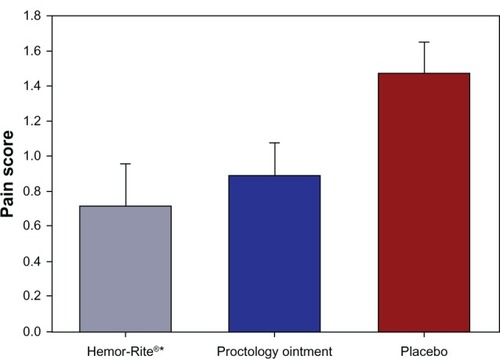
Table 1 Size of the effect per treatment group and sex
Table 2 Size of the effect corresponding to treatment group and sex
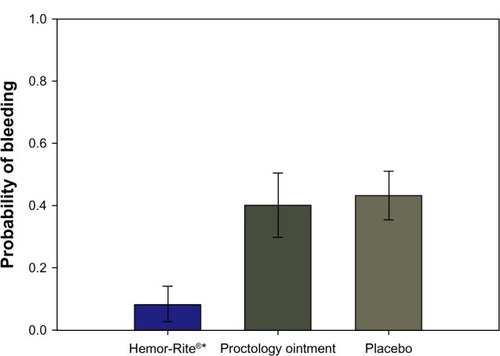
Table 3 The estimated probabilities of moderate to severe bleeding for the three treatment groups
Table 4 The probabilities of moderate to severe bleeding for the three treatment groups with a confidence interval of 95%
Figure 5 Probability of moderate or severe bleeding by treatment group (95% confidence interval).