Figures & data
Figure 1 The flow chart of the screening process.
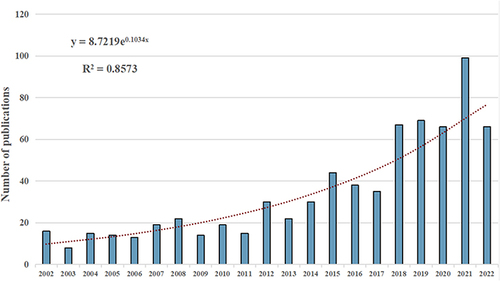
Figure 2 Global trends in publications on PPGP. The bar chart depicts the patterns in the expansion of scholarly articles globally from 2002 to 2022. The curve demonstrates the fitted growth trend model for publications.
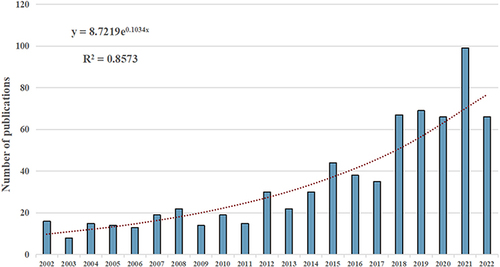
Table 1 The Top 10 Nations and Academic Organizations with the Highest Number of Publications in the Domain of PPGP
Figure 3 Countries involved in PPGP: (A) A cartographic representation of global country distribution within this domain (B) The top ten countries with the highest aggregate citation count.
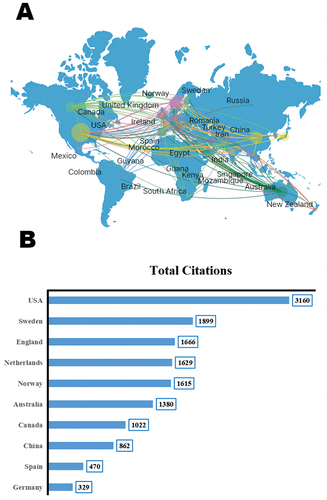
Figure 4 Co-authorship analysis of nations and establishments (A) Network visualization portraying the co-authorship interconnections among nations with more than 15 publications (B) Network visualization depicting the co-authorship associations among establishments with over 3 publications (C) Network visualization illustrating the co-authorship relationships among establishments with more than 3 publications, categorized based on the mean publication year (blue denoting earlier years, and yellow denoting later years).
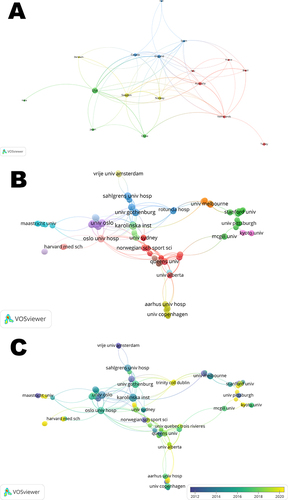
Figure 5 Analysis of journals (A) Articles published in various scholarly journals on PPGPs (B) Network visualization of journals that have been co-cited in more than 150 publications.
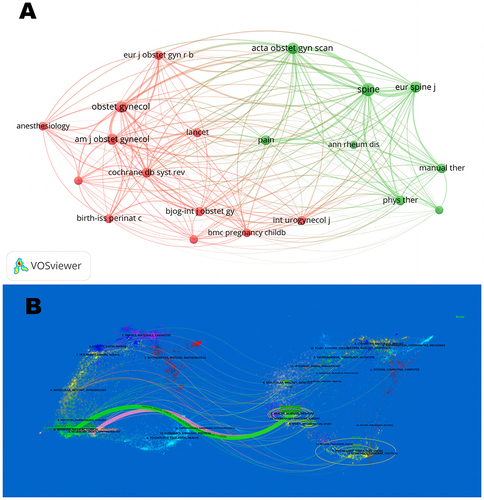
Table 2 The Top 10 Highly Influential Journals and Co-Cited Journals
Table 3 The Top 10 Prominent Research Domains
Table 4 The Top 12 Prolific Authors with the Highest Number of Publications and Citations in PGPP Research
Figure 6 Analysis of authors (A) Network visualization highlighting the co-authorship connections among authors who have contributed to more than three publications (B) Network visualization illustrating the co-cited authors who have received over 50 citations.
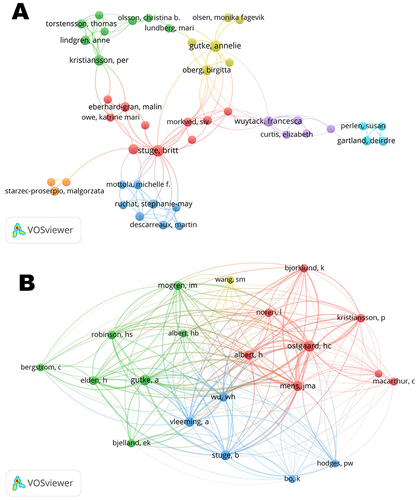
Figure 7 Mapping of documents and references in studies on PGPP (A) Network visualization of citation analysis for documents with more than 50 citations (B) Network visualization of co-citation analysis for references with more than 30 citations (C) Clustering analysis conducted on the co-citation network utilizing CiteSpace (D) Identification of the top 25 references exhibiting the most pronounced citation bursts with reference to CiteSpace.
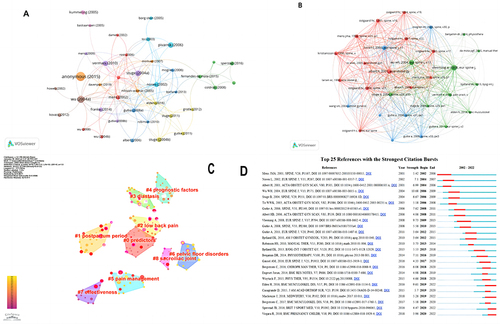
Table 5 The Top 10 Scholarly Articles with the Highest Number of Citations in the Domain of PGPP
Table 6 The Co-Citation Analysis of the Top Ten Cited References Within the Field of PGPP
Figure 8 Mapping of keywords in studies on PGPP (A) Network visualization depicting the distribution and interconnections of keywords (B) Assessment of keyword distribution based on the average publication year, with blue representing earlier years and yellow representing later years (C) Temporal visualization showcasing the evolution of keywords from 2012 to 2022.
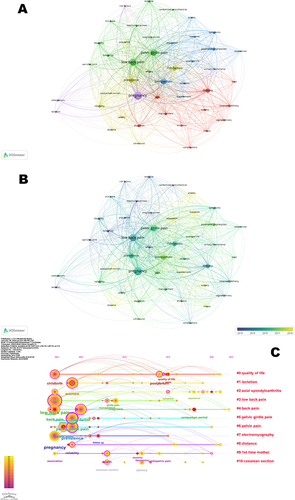
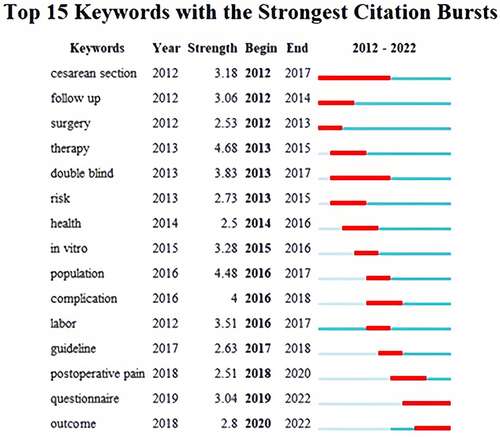
Figure 9 The top 15 keywords exhibiting the most pronounced citation bursts as determined by CiteSpace.