Figures & data
Table 1 The Topic Search Query
Figure 1 The annual number of publications on acupuncture treatment for CPPS between 2000 to 2022.
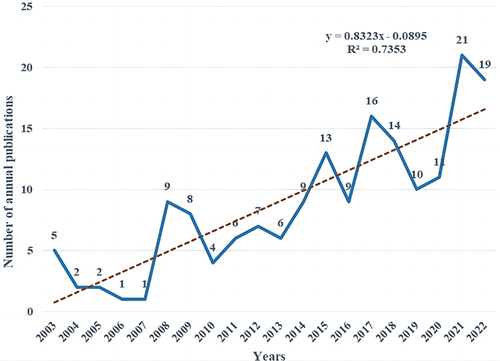
Figure 2 Type of publications on acupuncture treatment for CPPS between 2000 to 2022.
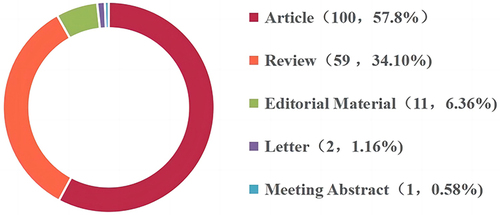
Table 2 Top 10 Scholarly Journals Related to Acupuncture on CPPS
Table 3 Top 10 Cited Journals and Centrality Related to Acupuncture Therapy on CPPS
Figure 3 Cited journal map related to acupuncture treatment on CPPS research from 2000 to 2022. The nodes in the map represent journals, and the lines between the nodes mean co-citation relationships. The different colors of the nodes represent the different years. The larger the node area, the greater the number of cocitations. The purple ring represents centrality, and nodes with high centrality are considered as pivotal points in the publications.
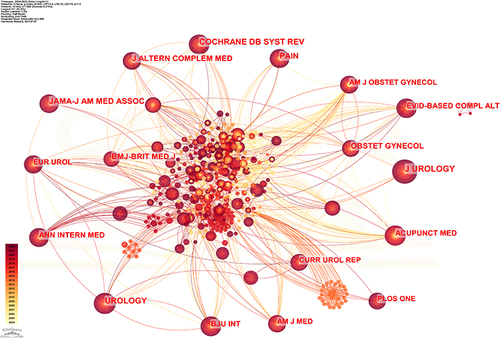
Figure 4 Dual-map overlay of journals related to Acupuncture on CPPS. In the map, the left side is the distribution of the cite journal where the literature is located, representing the main discipline of the research; the right side is the distribution of the cited journal where the literature is located, which represents which disciplines are mainly cited.
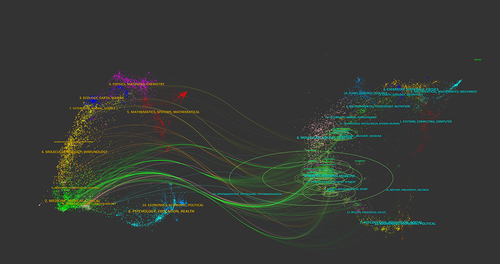
Figure 5 Geographical distribution of acupuncture on CPPS. The lines with the same color in the figure represent the closeness of the cooperative relationship between the connected countries, while the size of the circles indicates the magnitude of the country’s influence.
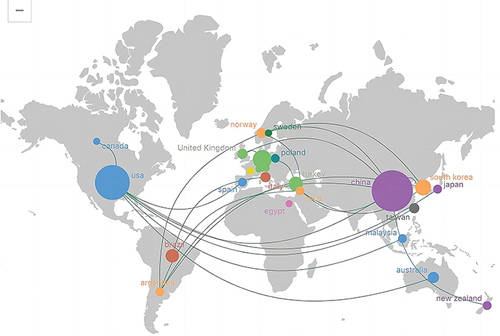
Table 4 Top 10 Publications and Centrality of Countries/Region Related to Acupuncture on CPPS
Table 5 Top 10 Publications and Centrality of Institutions Related to Acupuncture on CPPS
Figure 6 Map of institutions researching acupuncture on CPPS research from 2000 to 2022. The nodes in the map represent institutions, and the lines between the nodes represent collaborative relationships. The different colors in the nodes represent the different years, and the larger the node area, the larger the number of publications.
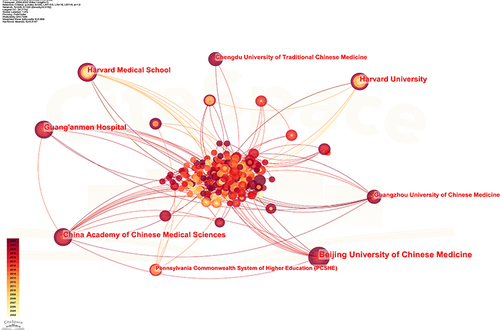
Table 6 Top 10 Prolific Authors Related to Acupuncture on CPPS
Figure 7 Map of authors related to acupuncture on CPPS research from 2000 to 2022. The nodes represent authors, and the lines between the nodes represent the collaborative relationships. The different colors of the nodes represent the different years. The larger the node area, the greater the number of publications.
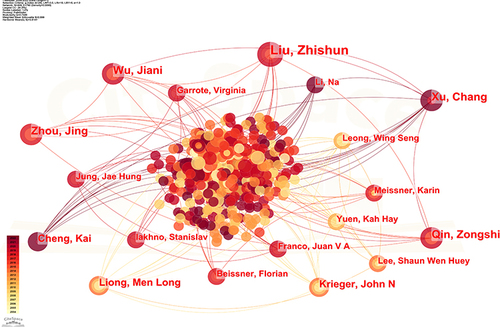
Table 7 Top 10 Frequency and Centrality of Cited Authors Related to Acupuncture on CPPS
Figure 8 Map of cited authors related to acupuncture on CPPS research from 2000 to 2022. The nodes represent authors, and the lines between the nodes represent the co-citation relationships. The different colors of the nodes represent the different years. The larger the node area, the greater the number of co-citations. The purple ring represents centrality, and nodes with high centrality are considered as pivotal points in the publications.
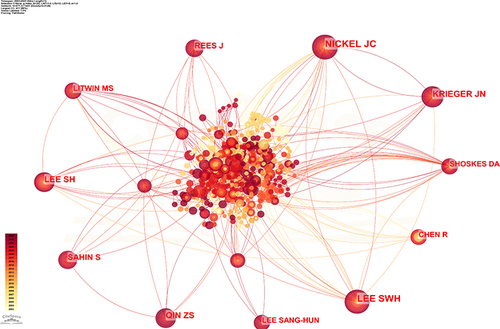
Figure 9 Cluster networks of cited references related to acupuncture on CPPS research from 2000 to 2022. In the map, each color represents a cluster. The smaller the clustering label, the more articles in the cluster.
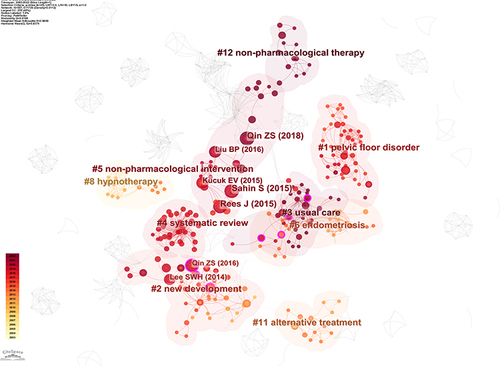
Table 8 Top 10 Frequency of Cited References Related to Acupuncture on CPPS
Table 9 Top 10 Centrality of Cited References Related to Acupuncture on CPPS
Figure 10 Timeline view of acupuncture on CPPS. In the map, the later the timeline corresponding to each cluster indicates that the more likely the cluster is to become a new research hotspot.
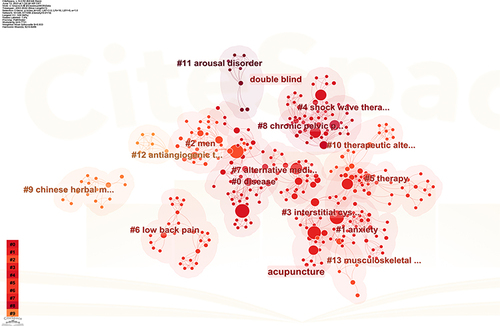
Table 10 Top 10 Frequency and Centrality of Keywords Related to Acupuncture on CPPS
Figure 11 Clustered networks of keywords related to acupuncture on CPPS research from 2000 to 2022. In the map, each color represents a cluster. The smaller the clustering label, the more articles in the cluster.
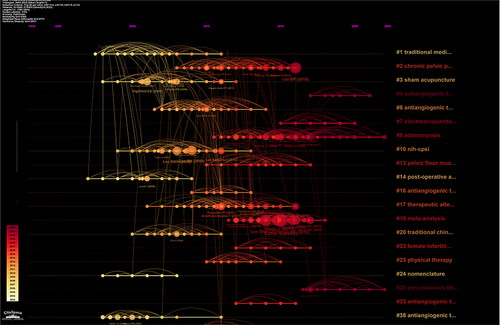
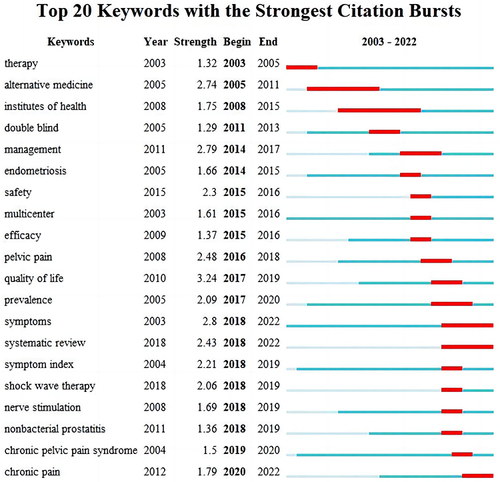
Figure 12 Top 20 keywords with the strongest citation bursts.