Figures & data
Table 1 Socio-Demographic, Pain, and Mental Health Characteristics by IHM Engagement
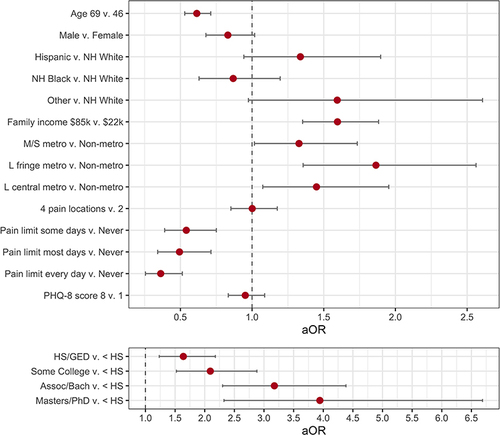
Figure 1 Adjusted Odds Ratios of Engaging in ≥1 IHM Modality for Pain.
Notes: Red dots represent point estimates for adjusted odds ratios, and error bars represent 95% confidence intervals. Education covariates are placed on a separate axis given their size to not obscure the other covariates.
Abbreviations: aOR, adjusted odds ratio; Assoc, associate’s; Bach, bachelor’s; fam, family; GED, general equivalency diploma; HS, high school; L, large; M, medium; metro, metropolitan; NH, Non-Hispanic; PHQ-8, Patient Health Questionnaire-8; S, small; v., versus; yrs, years.
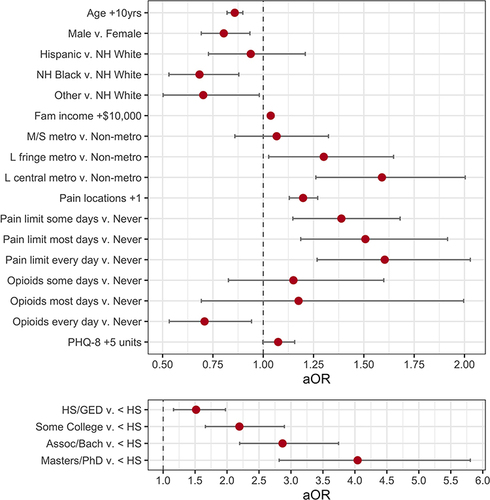
Figure 2 Relative Change in Count of IHM Modalities Used for Pain.
Notes: Red dots represent point estimates for relative change in count, and error bars represent 95% confidence intervals. Education covariates are placed on a separate axis given their size to not obscure the other covariates.
Abbreviations: aOR, adjusted odds ratio; Assoc, associate’s; Bach, bachelor’s; fam, family; GED, general equivalency diploma; HS, high school; L, large; M, medium; metro, metropolitan; NH, Non-Hispanic; PHQ-8, Patient Health Questionnaire-8; S, small; v., versus; yrs, years.
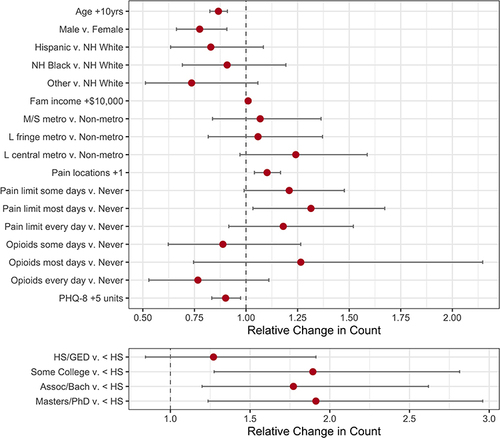
Table 2 Socio-Demographic, Pain, and Mental Health Characteristics by Nonpharmacologic Modality Engagement
Figure 3 Adjusted Odds Ratios of Using Nonpharmacologic Only vs Opioids Only.
Notes: Red dots represent point estimates for adjusted odds ratios, and error bars represent 95% confidence intervals. Education covariates are placed on a separate axis given their size to not obscure the other covariates.
Abbreviations: aOR, adjusted odds ratio; Assoc, associate’s; Bach, bachelor’s; fam, family; GED, general equivalency diploma; HS, high school; L, large; M, medium; metro, metropolitan; NH, Non-Hispanic; PHQ-8, Patient Health Questionnaire-8; S, small; v., versus; yrs, years.