Figures & data
Figure 1 The flow diagram of the selection process.
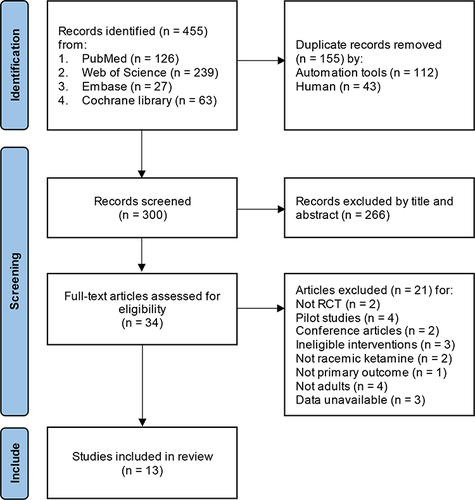
Table 1 Characteristics of Included RCTs
Figure 2 The risk of bias of the included studies; (a) risk of bias for each study; (b) risk of bias summary.
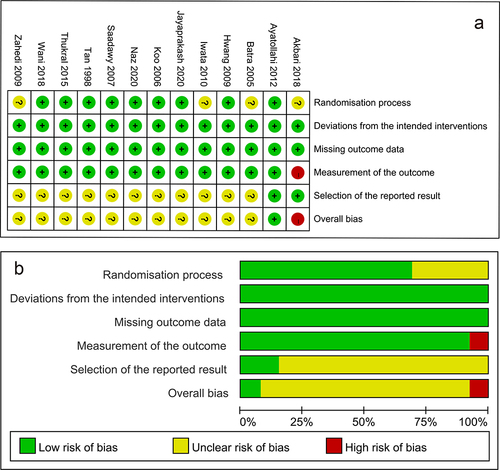
Figure 3 The incidence of propofol injection pain in the ketamine group compared with the saline group.
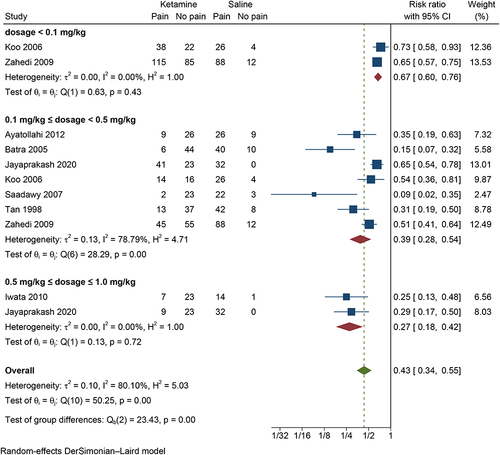
Figure 4 The incidence of propofol injection pain in the ketamine group compared with the lidocaine group.
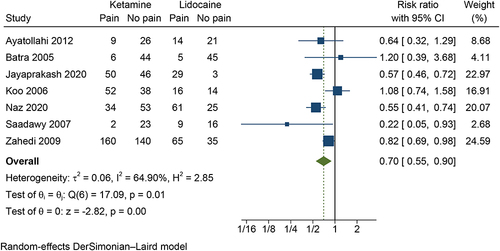
Figure 5 The incidence of propofol injection pain in the ketamine group compared with the dexmedetomidine group.
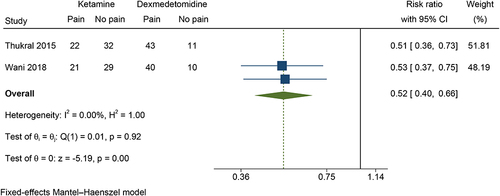
Figure 6 The incidence of propofol injection pain in the ketamine group compared with the thiopental group.
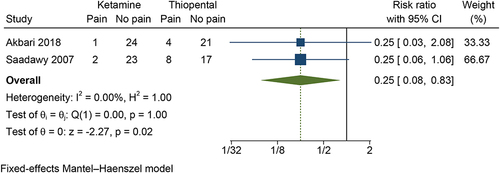
Figure 7 The incidence of propofol injection pain in the separate injection group compared with the mixed injection group.
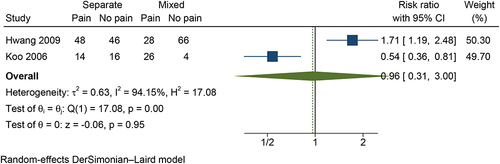
Figure 8 The incidence of severe propofol injection pain in the ketamine group compared with the saline group.
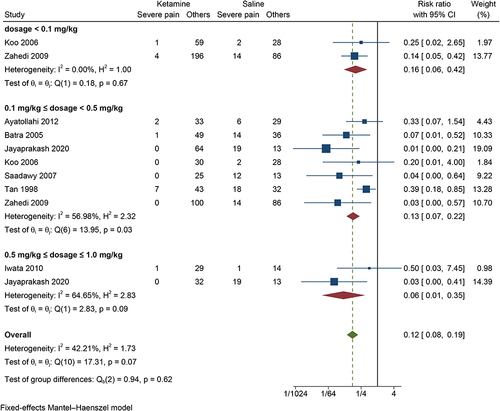
Figure 9 The incidence of severe propofol injection pain in the ketamine group compared with the lidocaine group.
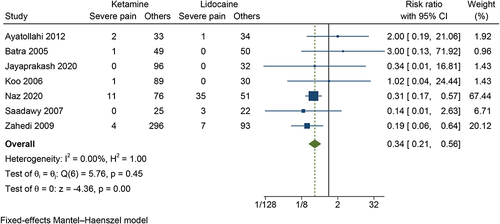
Figure 10 The incidence of severe propofol injection pain in the ketamine group compared with the dexmedetomidine group.
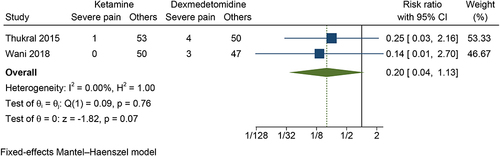
Figure 11 The incidence of severe propofol injection pain in the ketamine group compared with the thiopental group.
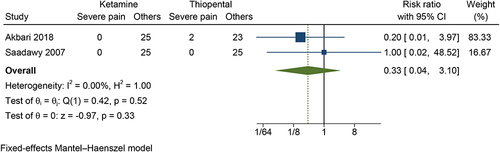
Figure 12 The incidence of severe propofol injection pain in the separate injection group compared with the mixed injection group.
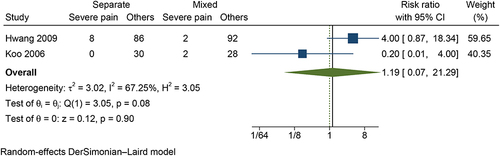
Figure 13 Sensitivity analysis for meta-analysis comparing the incidence of PIP in the ketamine group and the saline group.
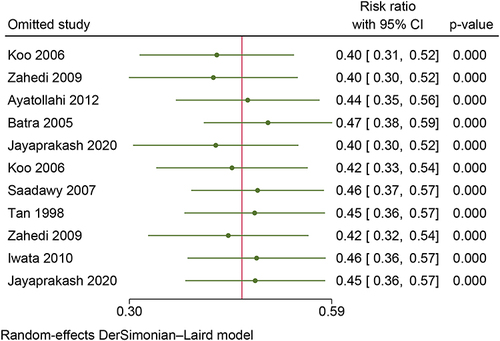
Figure 14 Sensitivity analysis for meta-analysis comparing the incidence of PIP in the ketamine group and the lidocaine group.
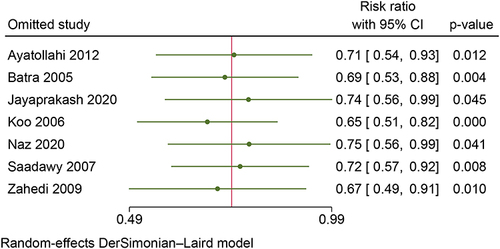
Table 2 Results of Egger Tests and Trim-and-Fill Procedure
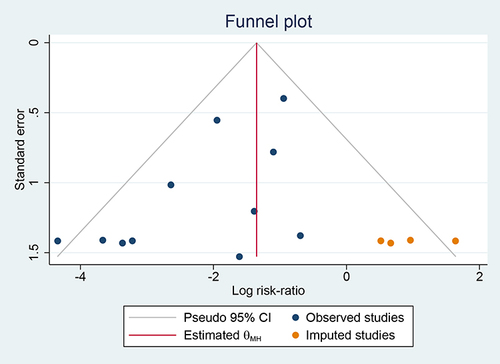
Figure 15 The funnel plot for the meta-analysis 1.1 processed by the trim-and-fill method.
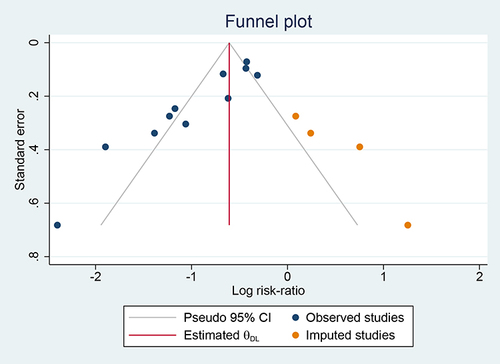
Figure 16 The funnel plot for the meta-analysis 2.1 processed by the trim-and-fill method.