Figures & data
Figure 1 The grading of isthmic spondylolisthesis based on the degree of slippage of one vertebral body on the adjacent vertebral body (Grade I <25%; Grade II: 25–50%; Grade III: 50–75%; Grade IV: 75–100%).
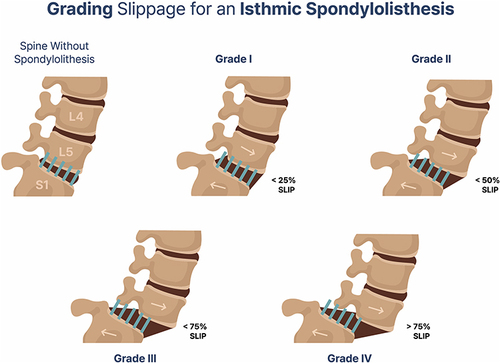
Table 1 Demographic Characteristics of Patients in Group 1 and Group 2
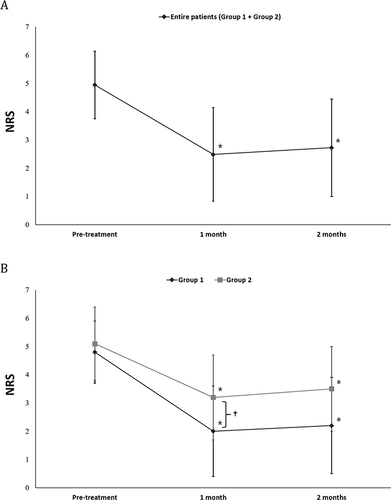
Figure 2 Change in NRS scores. (A) NRS scores in the entire cohort showed a significant decrease at 1 and 2 months after TFESI compared to pre-treatment. (B) NRS scores in Groups 1 and 2 revealed a significant decrease at 1 and 2 months after TFESI compared to pre-treatment. The intergroup changes over time were significantly different. One month after TFESI, the NRS scores were significantly lower in the Group 1 than in the Group 2. *p <0.05: intragroup comparison between 1 and 2 months post-treatment and pre-treatment (repeated measures one-factor analysis), †p <0.05: intergroup comparison at each time-point (repeated measures two-factor analysis).