Figures & data
Table 1 Validated patient-reported outcome measures included in the subject questionnaire
Figure 1 PTPS NeP subjects reported a variety of comorbid conditions.a
Abbreviations: PTPS, post-traumatic/post-surgical; NeP, neuropathic pain; BPI-SF, Brief Pain Inventory-Short Form.
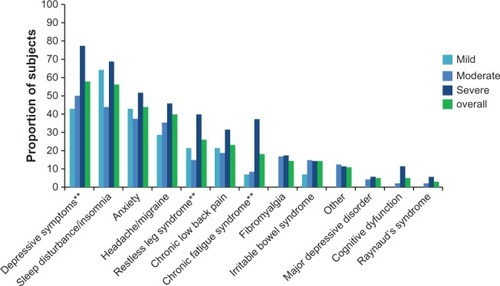
Table 2 Demographic and clinical characteristics, overall, by average pain severity
Figure 2 PTPS NeP subjects with more severe pain reported significantly worse physical and mental health.a
Abbreviations: PTPS, post-traumatic/post-surgical; NeP, neuropathic pain; BPI-SF, Brief Pain Inventory-Short Form; PCS, Physical Component Summary; MCS, Mental Component Summary; SF-12, Short-Form Health Survey.
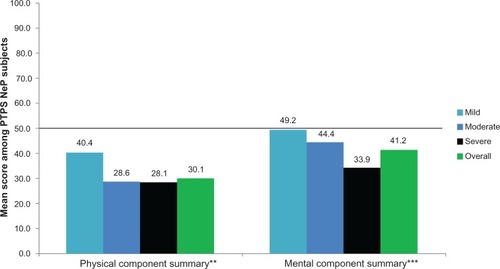
Figure 3 PTPS NeP subjects with more severe pain have significantly worse general health status.a
Abbreviations: PTPS, post-traumatic/post-surgical; NeP, neuropathic pain; BPI-SF, Brief Pain Inventory-Short Form; EQ-5D, EuroQol Five-Dimensions.
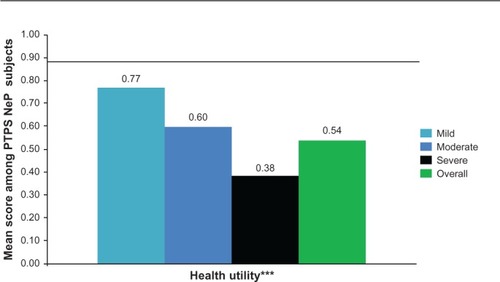
Figure 4 PTPS NeP subjects with more severe pain experience, more interference with function.a
Abbreviations: PTPS, post-traumatic/post-surgical; NeP, neuropathic pain; BPI-SF, Brief Pain Inventory-Short Form.
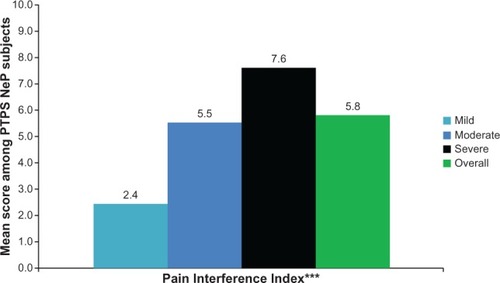
Figure 5 PTPS NeP subjects with more severe pain reported worse sleep outcomes.a
Abbreviations: PTPS, post-traumatic/post-surgical; NeP, neuropathic pain; BPI-SF, Brief Pain Inventory-Short Form; MOS-SS, Medical Outcomes Study Sleep Scale.
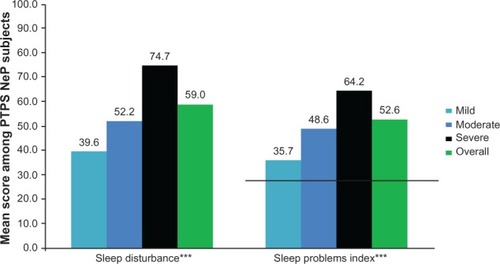
Figure 6 PTPS NeP subjects with more severe pain experience, more anxiety and depression.a
Abbreviations: PTPS, post-traumatic/post-surgical; NeP, neuropathic pain; BPI-SF, Brief Pain Inventory-Short Form; HADS, Hospital Anxiety and Depression Scale.
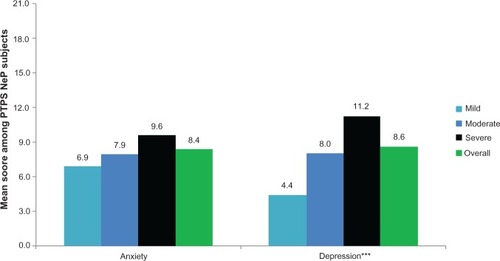
Figure 7 Use of PTPS NeP prescription medications.
Abbreviations: PTPS, post-traumatic/post-surgical; NeP, neuropathic pain; SNRI, serotonin–norepineprhine reuptake inhibitor; NSAIDs, nonsteroidal anti-inflammatory drugs; TCAs, tricyclic antidepressants.
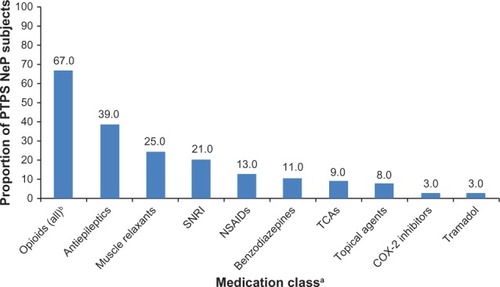
Table 3 Resource utilization for PTPS NeP, overall, by average pain severity
Figure 8 PTPS NeP impact on employment status.a,**
Abbreviations: PTPS, post-traumatic/post-surgical; NeP, neuropathic pain; BPI-SF, Brief Pain Inventory-Short Form.
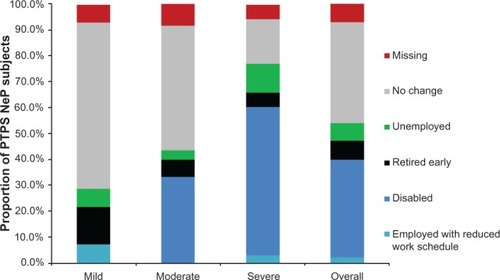
Figure 9 PTPS NeP subjects with more severe pain experienced greater losses in productivity.a
Abbreviations: PTPS, post-traumatic/post-surgical; NeP, neuropathic pain; BPI-SF, Brief Pain Inventory-Short Form; WPAI, Work Productivity and Activity Impairment.
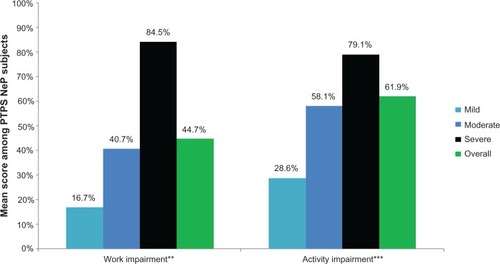
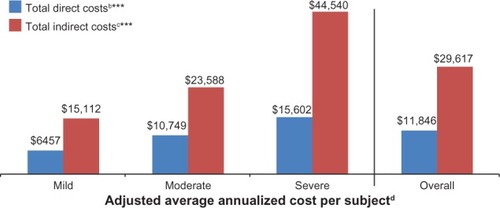
Figure 10 Adjusted average annualized cost per PTPS NeP subject, overall and by average pain severity.a
Abbreviations: PTPS, post-traumatic/post-surgical; NeP, neuropathic pain; BPI-SF, Brief Pain Inventory-Short Form; TENS, transcutaneous electrical nerve stimulation; LS, least squares.