
Figures & data
Table 1 Demographic Characteristics of the Participants
Figure 1 CONSORT flowchart describing patient progress throughout the study.
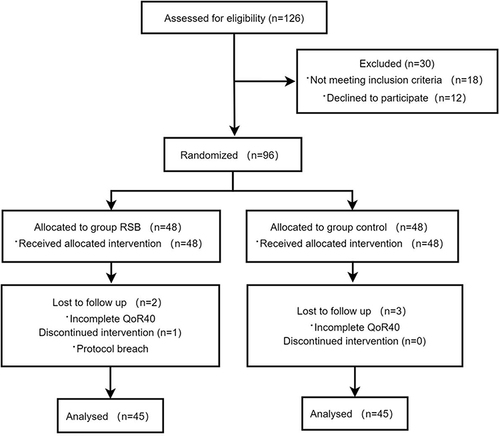
Table 2 Intraoperative Data
Figure 2 Global QoR-40 scores of two groups. The data are reported as the mean (SD) in each group.
Abbreviations: PRE, preoperative; POD1, postoperative day 1; POD3, postoperative day 3.
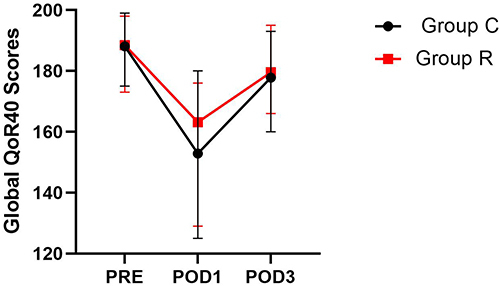
Table 3 Postoperative Data
Table 4 Results of Multiple Linear Regression Analysis
Data Sharing Statement
The authors declare that all data in the manuscript can be accessed upon request (contact e-mail: [email protected]).