
Figures & data
Figure 1 The diagram of the experimental process.
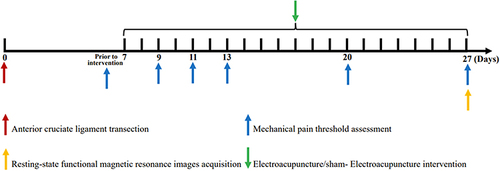
Figure 2 Comparison of mechanical pain threshold between the EA group and the sham-EA group.
Notes: *p<0.001; ns, not significant vs sham-EA; EA, electroacupuncture.
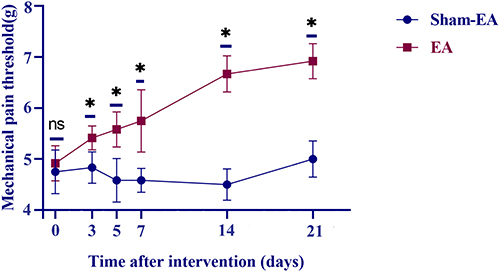
Figure 3 Comparison of functional connectivity between the EA group and the sham-EA group.
Notes: (A) p-value diagram by two-sample t-test of FC between the two groups (p<0.001). (B) t-value diagram by two-sample t-test of FC between the two groups; t>0 indicates that in comparison with the sham-EA group, the zFC of the EA group is higher and t<0 indicates that in comparison with the sham-EA group, the zFC of the EA group is lower. (C) in comparison with the sham-EA group, the connections whose zFC values are lower in the EA group. (D) in comparison with the sham-EA group, the connections whose zFC values are higher in the EA group.
Abbreviation: ic, internal capsule.
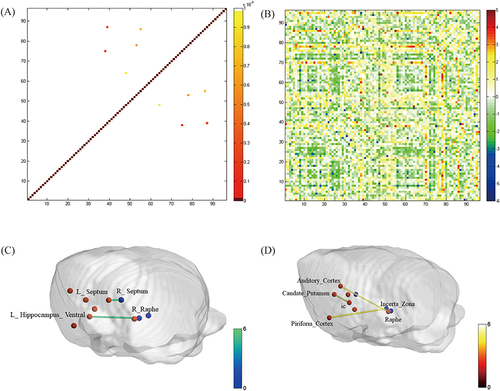
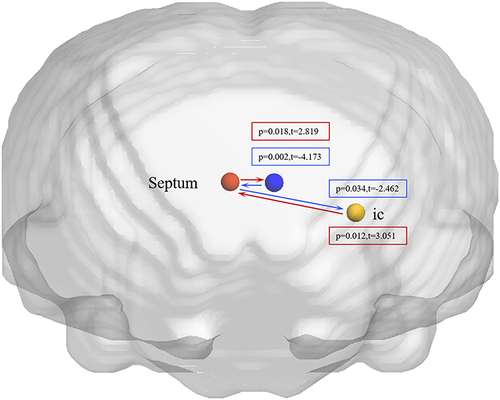
Figure 4 Comparison of effective connectivity between the EA group and the sham-EA group after 3-week intervention.
Notes: Red/ blue lines designate significantly higher/lower EC compared with the sham-EA group.
Abbreviation: ic, internal capsule.
Data Sharing Statement
The datasets used and/or analyzed during the current study are available from the corresponding author on reasonable request.