
Figures & data
Figure 1 Study flowchart.
Abbreviation: ITT, intent-to-treat.
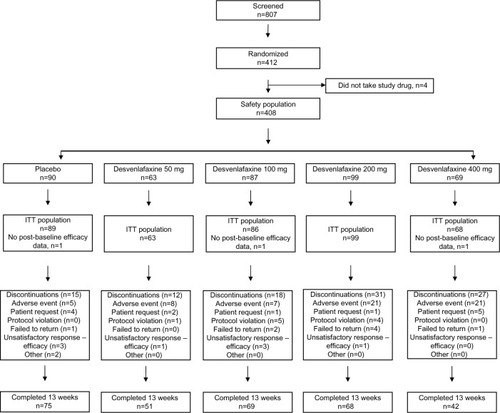
Table 1 Demographics and baseline characteristics, short-term study (safety population)
Figure 2 Adjusted mean change from baseline on NRS pain severity over time (ITT; MMRM).
Notes:
aP=0.084 (Hochberg) for desvenlafaxine 50 mg and 100 mg groups versus placebo; bP=0.027 (Hochberg) for desvenlafaxine 400 mg versus placebo; cP=0.001 (Hochberg) for desvenlafaxine 200 mg versus placebo.
Abbreviations: ITT, intent-to-treat; MMRM, mixed-effects model for repeated measures; NRS, numeric rating scale.
Abbreviations: ITT, intent-to-treat; MMRM, mixed-effects model for repeated measures; NRS, numeric rating scale.
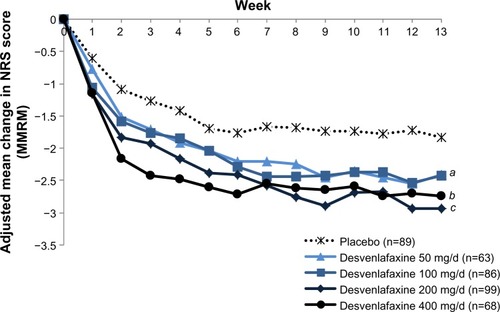
Figure 3 Response rate on pain severity score on the NRS at week 13 (ITT).
Notes:
aNRS response is defined as a reduction of 50% or more from baseline; bno significant differences from placebo for active treatment groups.
Abbreviations: ITT, intent-to-treat; NRS, numeric rating scale.
Abbreviations: ITT, intent-to-treat; NRS, numeric rating scale.
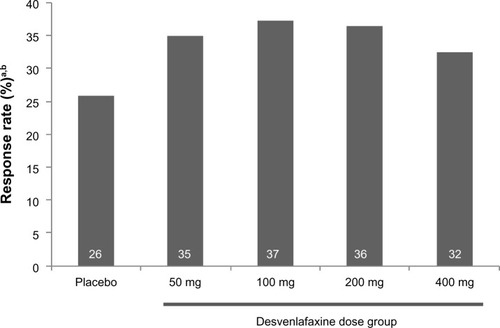
Figure 4 Proportions of patients achieving minimum thresholds of reduction in NRS score at week 13 (ITT).
Abbreviations: ITT, intent-to-treat; NRS, numeric rating scale.
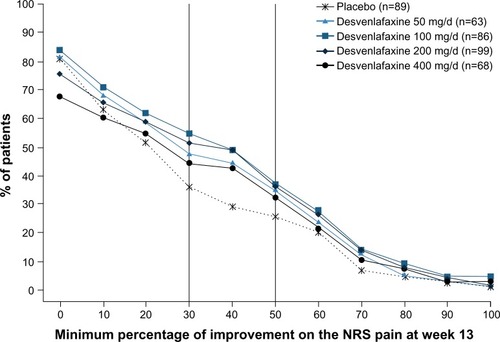
Table 2 Secondary efficacy endpoints (MMRM), short-term study (intent-to-treat population)
Table 3 Treatment-emergent adverse events in ≥5% and twice that of placebo for patients in any treatment group, short-term study (safety population)
Table 4 Selected vital signs and laboratory values at week 13 (LOCF), short-term study (safety population)