
Figures & data
Figure 1 Radiculogram demonstrating needle placed near the dorsal root ganglion at L5 (left) and S1 (right).
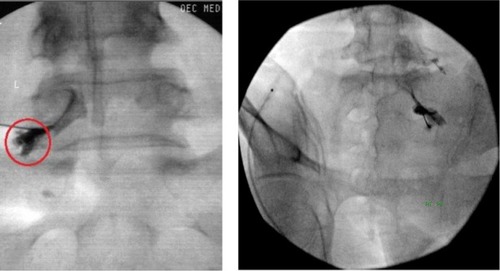
Figure 2 CONSORT flow chart.
Abbreviations: PRF, pulsed radiofrequency; TFESI, transforaminal epidural steroid injection.
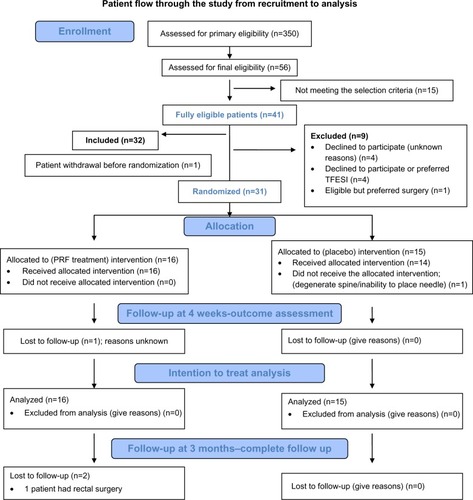
Table 1 Comparison between the two groups for demographic variables, levels of DRG treated, and possible etiology of CLR pain
Figure 3 Comparison of mean visual analog scores between the two groups shown as a plot over time.
Abbreviations: OP, operation; PRF, pulsed radiofrequency; VAS, visual analog scale.
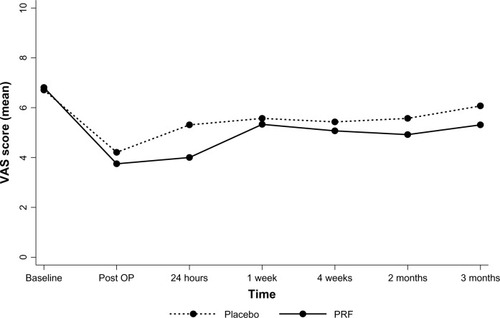
Figure 4 Comparison of mean Oswestry Disability Index (ODI) scores between the two groups shown as a plot over time.
Abbreviation: PRF, pulsed radiofrequency.
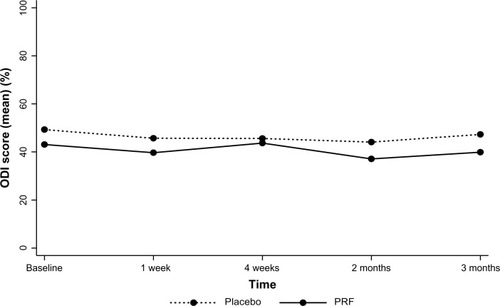
Table 2 Differences between the two groups in VAS score post intervention
Table 3 Difference between the two groups for ODITable Footnote* scores post intervention