
Figures & data
Figure 1 The sequence of stages in the protocol used in experiment 1. The sequence in experiment 2 was identical except that the order of presentation of the values manipulation and pre-intervention pain task stages was reversed.
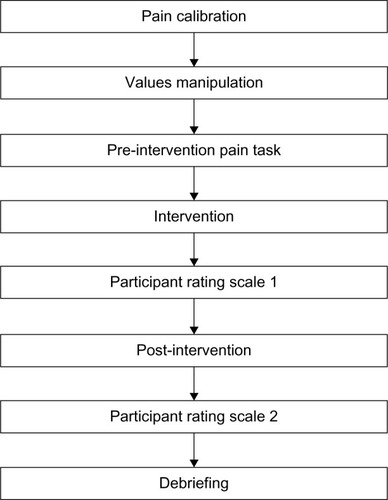
Table 1 Results of a three-way mixed analysis of variance; the effect of strategy and value on shock tolerance during pre-intervention and post-intervention matching tasks in experiment 1
Table 2 Results of three-way mixed analysis of variance; the effect of strategy and value on self-reported pain during pre-intervention and post-intervention matching tasks in experiment 1
Table 3 Mean scores and standard deviations (in parentheses) for participants in each condition on each variable in participant rating scales 1 and 2 (usefulness and difficulty of the strategies) in experiment 1
Table 4 Results of a two-way analysis of covariance; the effect of strategy and value on shock tolerance during pre-intervention and post-intervention matching tasks
Table 5 Results of three-way mixed analysis of variance; the effect of strategy and value on self-reported pain intensity during pre-intervention and post-intervention matching tasks in experiment 2
Table 6 Mean scores and standard deviations (in parentheses) for participants in each condition on each variable in participant rating scales 1 and 2 (usefulness and difficulty of the strategies) in experiment 2