
Figures & data
Figure 1 Decision-making structures important during the Iowa gambling task.
Abbreviations: P, precuneus; B, brainstem; CC, cingulated cortex; V, ventromedial prefrontal cortex; H, hippocampus; A, amygdala; I, insula.
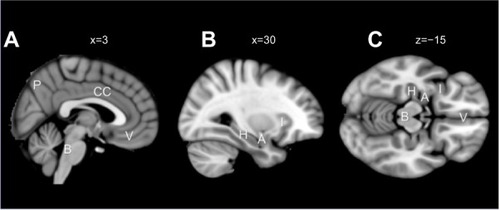
Figure 2 The generation of SCR during the IGT in the PCP and HC groups in the present study in light of the somatic marker hypothesis.
Abbreviations: SCR, skin conductance response; IGT, Iowa gambling task; PCP, patients with chronic pain; HC, healthy control; n, choice number; vmPFC, ventromedial prefrontal cortex.
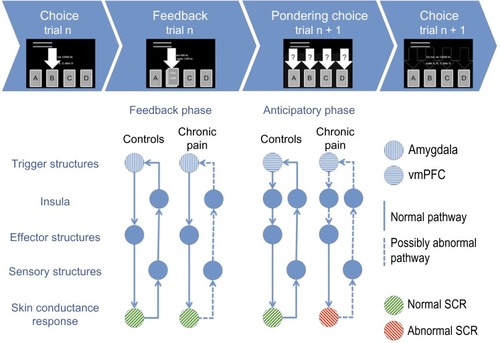
Figure 3 The Iowa gambling task.
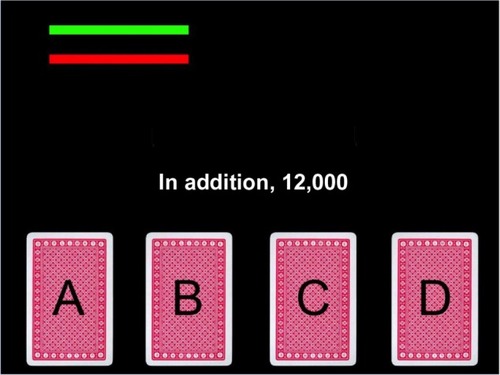
Table 1 Demographic, clinical, and working memory measures in patients with chronic pain and matched healthy controls
Table 2 IGT total scores and switching in the learning phase (1–40 cards) and performance phase (41–100 cards), and brain volumes in PCP and matched HCs
Table 3 Correlations between pain level, the different IGT scores, and SCR before and during the IGT in PCP and matched HCs
Figure 4 Autonomic measures from the anticipatory phase of the Iowa gambling task before drawing from either the advantageous or disadvantageous decks.
Abbreviations: SCR, skin conductance response; RR, R wave to R wave intervals; BP, systolic blood pressure; PCP, patients with chronic pain; HCs, healthy controls.
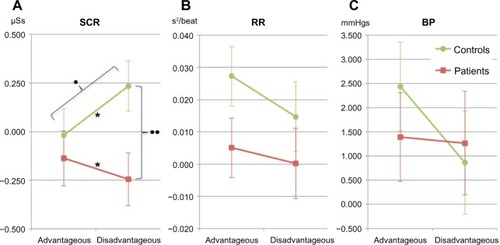
Table 4 Results of the mixed ANOVA (group × choice type) analyses of the autonomic SCR, heart rate (RR), and BP before choosing from the disadvantageous or the advantageous decks in PCP and matched HCs
Figure 5 SCR during the Iowa gambling task for pain patients and controls.
Abbreviations: SCL, skin conductance level; SCR, skin conductance response; PCP, patients with chronic pain; HCs, healthy controls; ANOVA, analysis of variance.
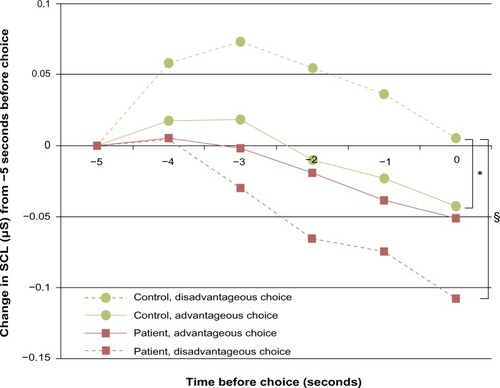
Table 5 SCR before disadvantageous and advantageous choices, and after receiving reward and punishment cards in the IGT in PCP and matched HCs
Table 6 Cardiac autonomic regulation during the IGT and rest in PCP and matched HCs
Table 7 Correlations between IGT behavior and autonomic measures and brain volumes in PCP and matched HCs