
Figures & data
Table 1 Summary of individual IMPROVE Study results
Table 2 Demographics and baseline characteristics (safety population)
Figure 1 Mean per-patient postsurgical opioid consumption; amounts are expressed in morphine mg equivalents.
Notes: Error bars represent SD; P<0.0001 for the between-group comparison.
Abbreviations: IV, intravenous; PCA, patient-controlled analgesia; SD, standard deviation.
Abbreviations: IV, intravenous; PCA, patient-controlled analgesia; SD, standard deviation.
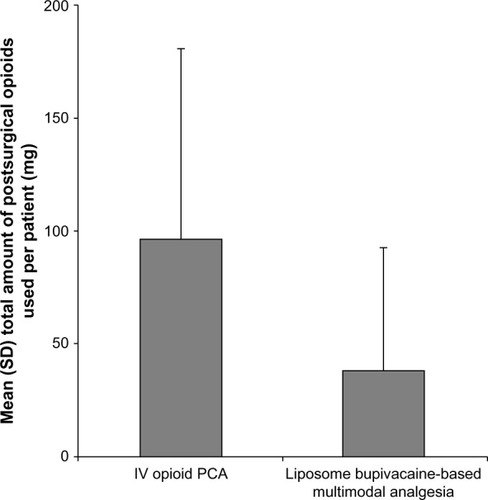
Figure 2 Median postsurgical LOS in days.
Notes: Error bars represent 95% CIs for the median; P<0.0001 for the between-group comparison.
Abbreviations: CIs, confidence intervals; IV, intravenous; LOS, length of stay; PCA, patient-controlled analgesia.
Abbreviations: CIs, confidence intervals; IV, intravenous; LOS, length of stay; PCA, patient-controlled analgesia.
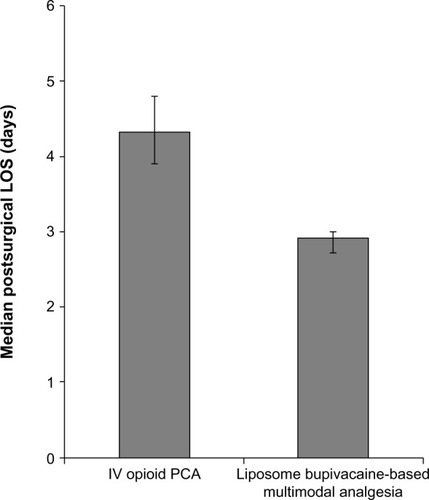
Figure 3 Geometric mean per-patient total cost of hospitalization (US$).
Note:
P=0.0109 for the between-group comparison.
Abbreviations: IV, intravenous; PCA, patient-controlled analgesia.
Abbreviations: IV, intravenous; PCA, patient-controlled analgesia.
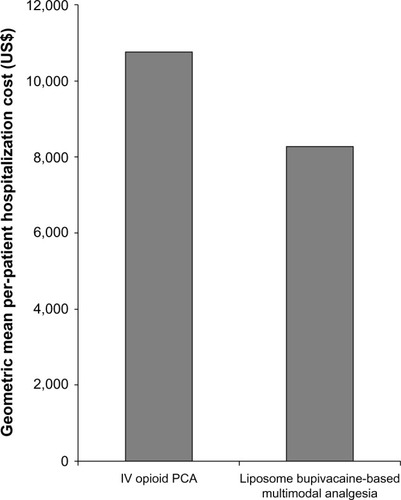
Table 3 Summary of opioid-related adverse events (efficacy population)
Table 4 Results for other secondary efficacy outcome measures (efficacy population)
Table 5 Summary of adverse events reported in equal to or greater than 3% of patients in either study group (safety population)