
Figures & data
Figure 1 Flowchart showing numbers of participating children from W1 to W3.
Abbreviations: W1, wave 1 (2003); W2, wave 2 (2004); W3, wave 3 (2005).
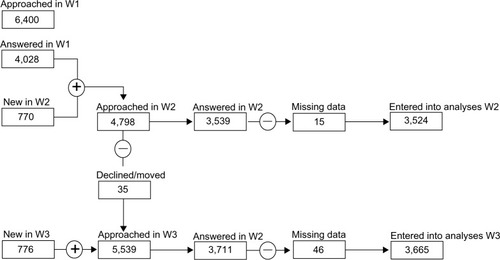
Figure 2 Flowchart for the headache incidence sample.
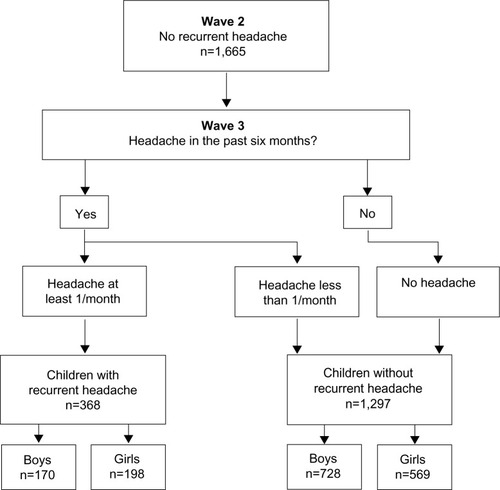
Figure 3 Flowchart for the back pain incidence sample.
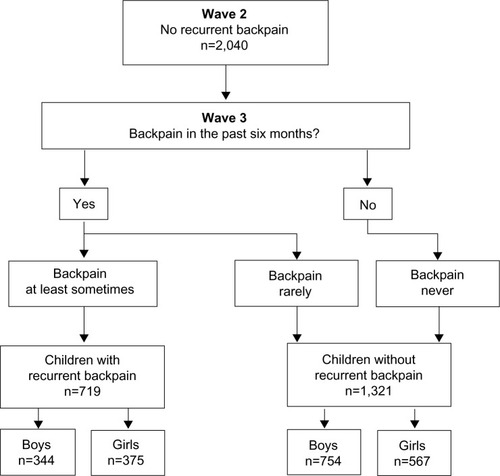
Table 1 Dependent variable (criterion 1): headache frequency in the last 6 months (wave 3)
Table 2 Control variables for headache: age and sex (wave 2)
Table 3 Predictor variables for headache (wave 2)
Table 4 Dependent variable (criterion 2): back pain in the last 6 months (wave 3)
Table 5 Control variables for back pain: age and sex (wave 2)
Table 6 Predictor variables for back pain (wave 2)
Table 7 Summary of univariable and multivariable logistic regression analyses predicting the incidence of headache in boys and girls
Table 8 Summary of univariable and multivariable logistic regression analyses predicting the incidence of back pain in boys and girls
Table S1 Instruments with which the predictor variables (wave 2) were measured