
Figures & data
Table 1 Word pairs
Figure 1 Visual depiction of counter-balanced trials of words presented during the dot-probe task.
Notes: Sensory pain word (target, t) on left (l) side of screen followed by the dot (d) on the left side of the screen (left, congruent or “tldl”), sensory pain word on left side of screen followed by the dot on the right (r) side of the screen (left, incongruent or “tldr”), sensory pain word on right side of screen followed by the dot on the right side of the screen (right, congruent or “trdr”), and sensory pain word on right side of screen followed by the dot on the left side of the screen (right, incongruent or “trdl”).
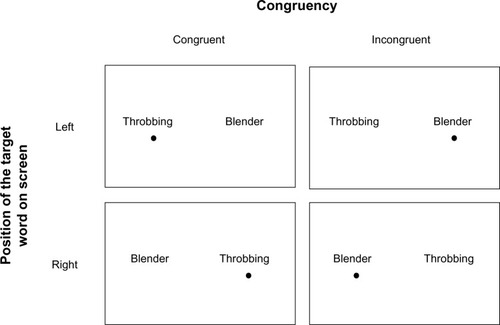
Table 2 Hypothesis 1: reaction time index scores (in milliseconds) for the chronic pain group (n=51) and the pain-free group (n=62)
Figure 2 Frequency of fixations for each group.
Notes: Error bars display the standard error. **P<0.01.
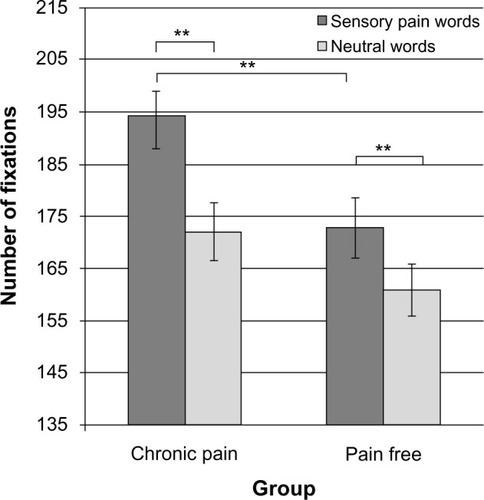
Table 3 Hypotheses 2–4: frequency and duration of eye-tracking dependent variables for the chronic pain group (n=51) and the pain-free group (n=62)
Figure 3 Average visit duration for each group.
Notes: Error bars display the standard error. **P<0.01.
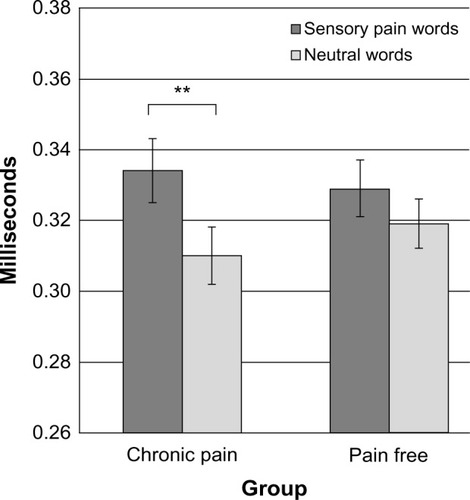
Figure 4 Late-phase total fixation duration for each group.
Notes: Error bars display the standard error. **P<0.01.
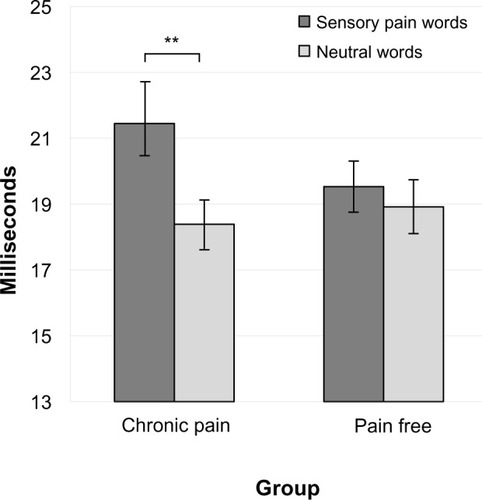
Table 4 Hypothesis 5: comparisons between the chronic pain group (n=51) and pain-free group (n=62) according to questionnaire data