Figures & data
Figure 1 Design of the three clinical trials.
Abbreviations: bid, twice daily; IHR, inguinal hernia repair; TKA, total knee arthroplasty.
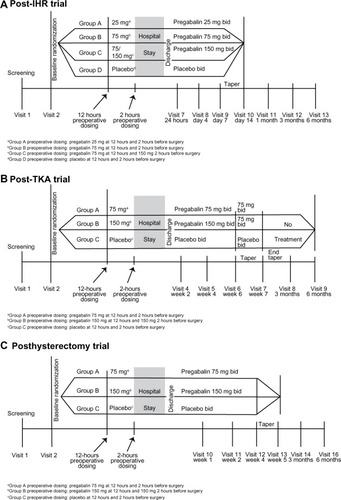
Table 1 Details of permitted preoperative, intraoperative, and postoperative anesthesia and analgesia techniques
Figure 2 Participant disposition.
Abbreviations: AE, adverse event; GCP, good clinical practice; IHR, inguinal hernia repair; MITT, modified intent-to-treat population; PGB, pregabalin; TKA, total knee arthroplasty.
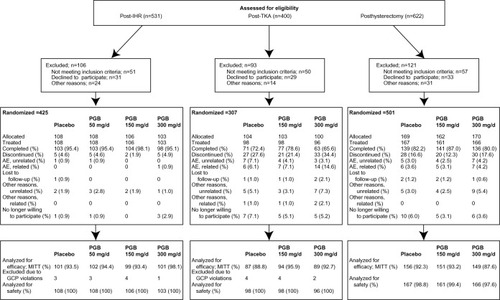
Table 2 Participant demographics
Table 3 Measures of pain 72 hours postsurgery
Figure 3 Movement-related pain (numerical rated scale) at 1 hour, 2 hours, and 2 days post-IHR.
Notes:
aP-value vs placebo <0.05; bP-value vs placebo <0.01. Data for 3 hours and Day 4, 5, 6, 7 postsurgery and at end of treatment not shown (all endpoints not significant).
Abbreviations: IHR, inguinal hernia repair; LS, least squares; NRS, numerical rated scale; SE, standard error.
Abbreviations: IHR, inguinal hernia repair; LS, least squares; NRS, numerical rated scale; SE, standard error.
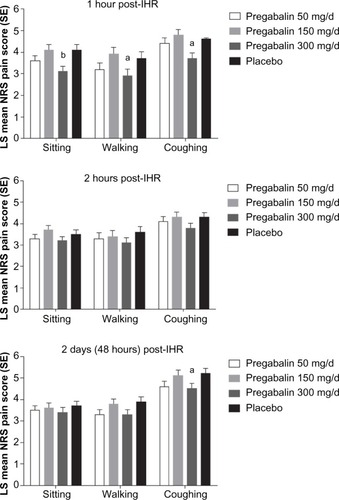
Table 4 Cumulative total amount of opioids (oral morphine equivalents [mg])
Table 5 Most common treatment-emergent adverse events (n [%], all-causality) in any treatment group in any trial
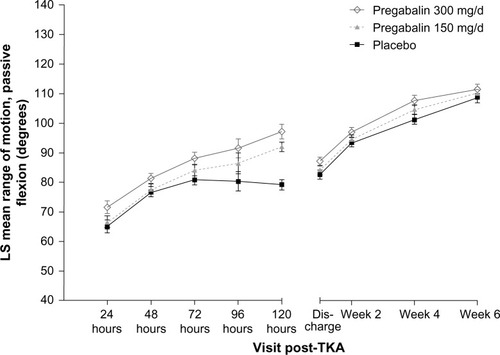
Figure 4 Passive range of motion of the operated knee post-TKA.
Notes: Pregabalin 150 mg/d vs placebo; P<0.05 at 120 hours post-TKA. Pregabalin 300 mg/d vs placebo; P<0.01 at 72, 96, and 120 hours post-TKA. P<0.05 at 24 hours, at discharge, and at Week 4 post-TKA.
Abbreviations: LS, least squares; TKA, total knee arthroscopy.
Abbreviations: LS, least squares; TKA, total knee arthroscopy.