Figures & data
Table 1 Stratification of patients based on pain questionnaires and disease activity indices
Figure 1 (A) Table showing categorization of rheumatoid arthritis group by pain stratification using visual analog scale (VAS) and painDETECT questionnaires. The numbers (N) represent number of participants in the study with the scoring for unlikely neuropathic pain (UNP), possible neuropathic pain (PNP), and likely neuropathic pain (LNP), respectively. (B) Scatter graph showing relationship between VAS (mm) and painDETECT for the rheumatoid arthritis group. The R2 value shows a positive correlation between VAS and painDETECT.
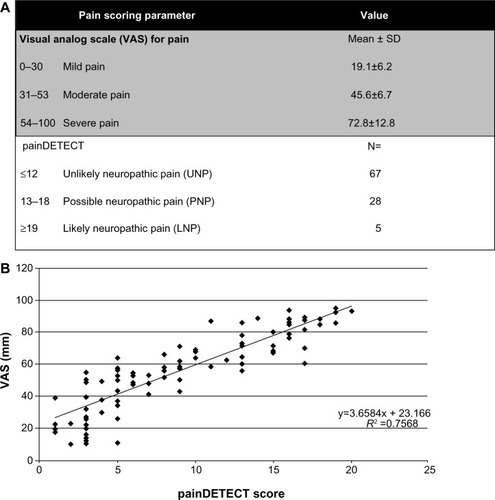
Table 2 Demographic characteristics for participants with rheumatoid arthritis and their use of disease-modifying drugsTable Footnotea
Table 3 Characteristics for age, body mass index, sex, smoking history, and duration of diagnosis for rheumatoid arthritis study groupTable Footnotea
Figure 2 (A) Box plot graph of the distribution of the mean visual analog scale (VAS) according to sex. (B) Box and whiskers plot of the distribution of the mean VAS with respect to present pain at the time of questioning compared with worst pain experienced (*P<0.05).
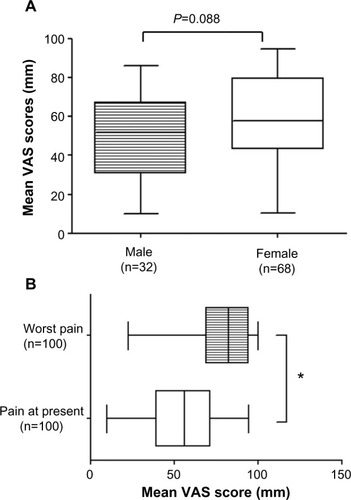
Figure 3 (A) Table showing categorization of rheumatoid arthritis group by body mass index (BMI). (B) Bar graph showing the distribution of visual analog scale (VAS) by BMI in the rheumatoid arthritis group. Participants were subgrouped by BMI into normal, overweight, and obese. The number (N) of participants within each BMI category is given. The mean (standard deviation [SD]) VAS in the groupings described is shown. There were statistically significant differences observed in the overweight and obese groups compared with controls (**P<0.01, ****P<0.0001).
![Figure 3 (A) Table showing categorization of rheumatoid arthritis group by body mass index (BMI). (B) Bar graph showing the distribution of visual analog scale (VAS) by BMI in the rheumatoid arthritis group. Participants were subgrouped by BMI into normal, overweight, and obese. The number (N) of participants within each BMI category is given. The mean (standard deviation [SD]) VAS in the groupings described is shown. There were statistically significant differences observed in the overweight and obese groups compared with controls (**P<0.01, ****P<0.0001).](/cms/asset/4e9da970-6bb4-4b8a-a33b-a5d672f68e4c/djpr_a_69011_f0003_b.jpg)
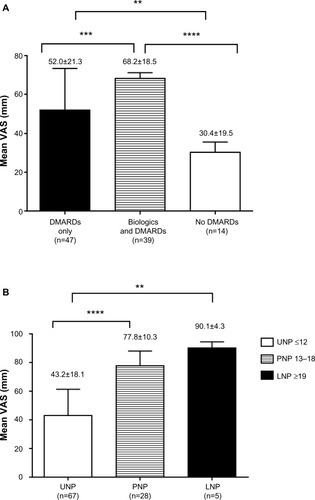
Figure 4 (A) Bar graph showing mean ± standard deviation pain scores for visual analog scale (VAS) and their relationship to use of disease-modifying antirheumatic drug (DMARD) therapy in the rheumatoid arthritis group (**P≤0.01; ***P≤0.001; ****P≤0.0001). (B) Bar graph showing the relationship between the mean ± standard deviation VAS and painDETECT questionnaire. Participants were grouped into three: unlikely neuropathic pain (UNP), possible neuropathic pain (PNP), and likely neuropathic pain (LNP) (**P≤0.01; ****P≤0.0001).