Figures & data
Figure 1 Overview of milnacipran studies.
Abbreviations: DB, double-blind; MLN, milnacipran; OL, open-label.
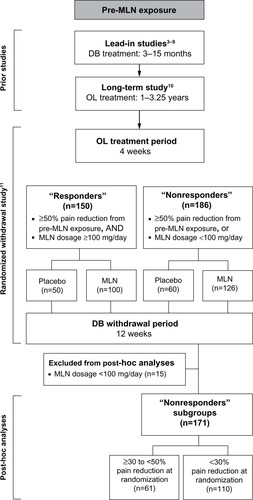
Figure 2 Distribution of pain response at randomization in patients who received milnacipran ≥100 mg/day during the prior long-term, open-label study.
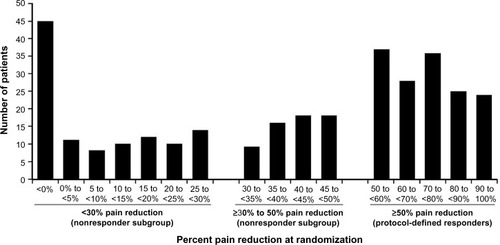
Table 1 Mean scores prior to milnacipran exposure and at study randomizationTable Footnotea
Figure 3 Mean changes from pre-milnacipran exposure in VAS pain scores.
Notes: The group with ≥50% pain reduction at randomization represents the protocol-defined responder population of the randomized withdrawal study; *P<0.05 versus milnacipran; **P<0.01; ***P<0.001.
Abbreviations: MLN, milnacipran; VAS, visual analog scale.
Abbreviations: MLN, milnacipran; VAS, visual analog scale.
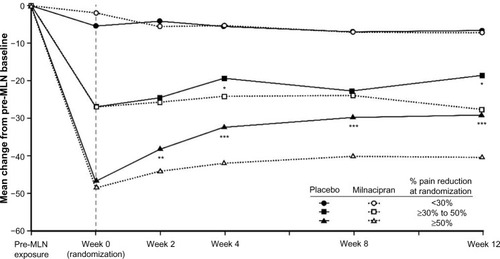
Table 2 Mean changes from randomization to end of the 12-week withdrawal period
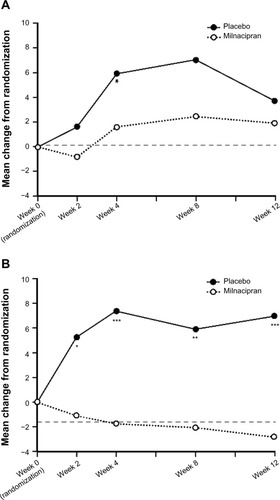
Figure 4 Mean change from randomization in Fibromyalgia Impact Questionnaire-Revised total scores in (A) ≥30% to <50% pain reduction subgroup and (B) <30% pain reduction subgroup.
Notes: *P<0.05 versus milnacipran; **P<0.01; ***P<0.001.