
Figures & data
Table 1 Demographics and disease characteristics of patients included in the survey
Table 2 Medications on admission and follow-up
Figure 1 Pain-intensity scores on admission and follow-up.
Notes: (A) Frequency distribution of pain-intensity scores on admission. (B) Frequency distribution of pain-intensity scores on follow-up. Pain intensities were assessed with an 11-point numeric rating scale (NRS-11). (C) Frequency distribution of categorized pain intensities. NRS scores were converted into severity categories, with NRS 1–4 representing mild, 5–7 moderate, and 8–10 severe pain. The proportion of patients with mild (P=0.031) and moderate (P=0.016) pain was significantly different on follow-up compared to admission (χ2 test). White bars, pain on admission; grey bars, pain on follow-up. *P<0.05
Abbreviation: NA, not applicable (no response recorded).
Abbreviation: NA, not applicable (no response recorded).
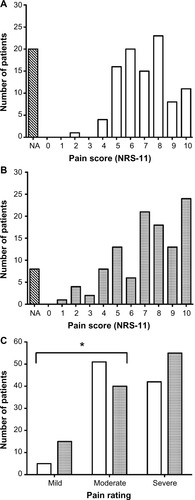
Table 3 Meaningful changes in BPI-SF variables
Figure 2 Frequency distributions of scores for change in pain, subjective improvement, and patient satisfaction.
Notes: (A) Change in pain scores. These were calculated as an 11-point numeric rating scale (NRS-11) score on follow-up minus NRS-11 score on admission. Negative scores indicated improvement and positive scores implied worsening of pain intensity. Change scores ≤−2 (white bars) and ≥+2 (black bars) were regarded as clinically meaningful. Gray bars indicate number of patients who did not experience meaningful changes in pain intensity. (B) Frequency distribution of subjective improvement scores. (C) Frequency distribution of patient-satisfaction scores. Improvement and satisfaction were assessed employing the NRS-11, where 0 represented the worst and 10 the best possible outcome.
Abbreviation: NA, not applicable (no response recorded).
Abbreviation: NA, not applicable (no response recorded).
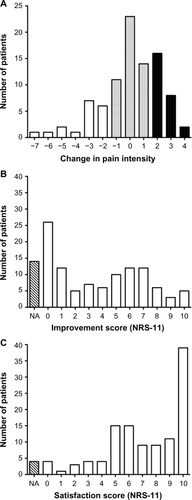
Table 4 Correlation matrix of variables assessed