
Figures & data
Table 1 Description of variables included in bivariate analysis
Table 2 Baseline sociodemographic and health characteristics
Table 3 Baseline clinical characteristics, diagnostic classification, and triage recommendations
Figure 1 Proportion of participants that improved versus those that did not improve.
Abbreviations: NPRS, Numeric Pain Rating Scale; ODQ, Oswestry Disability Questionnaire; SF-36 PCS, Medical Outcomes Survey 36-item short-form; PCS, physical component summary; MCS, mental component summary.
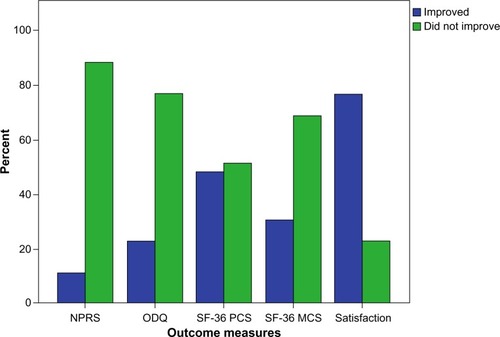
Table 4 Proportion of participants who improved versus those who did not improve
Table 5 Crude and adjusted estimates for improvement in perceived pain, function, general health, and satisfaction