
Figures & data
Table 1 Demographics, level of pain, depression, and sleep quality and working memory performance in 15 chronic pain patients and matched healthy controls
Figure 1 Body map over pain location in CP group.
Abbreviation: CP, chronic pain.
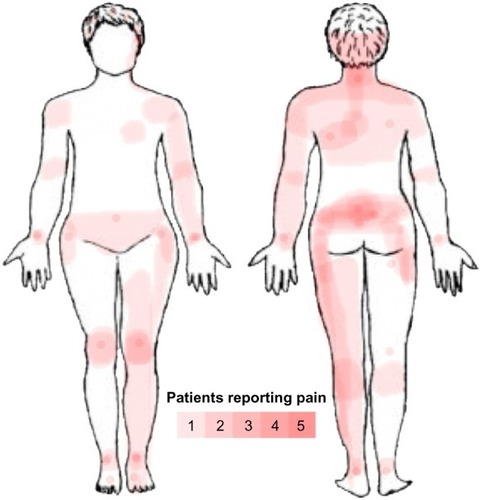
Table 2 Performance on the fMRI paradigms for chronic pain patients and healthy controls
Table 3 Correlations between working memory test, pain (NRS), depression (BDI), and sleep problems (PSQI) scores in chronic pain patients
Figure 2 Between-group differences in working memory activation.
Abbreviations: HC, healthy controls; CP, chronic pain; PVSAT, paced visual serial addition test; MNI, Montreal Neurological Institute.
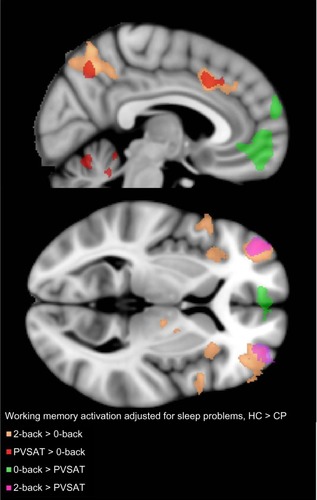
Figure 3 Brain regions with decreased activation at the whole brain level for contrast 0-back > 2-back with sleep problem score (PSQI), and scores for depression (BDI) and pain (NRS) as orthogonalized covariates in the CP group alone (blue), HC group alone (yellow), and the significant difference between them (HC > CP; green).
Abbreviations: HC, healthy controls; CP, chronic pain; PSQI, Pittsburgh Sleep Quality Index score; BDI, Beck Depression Inventory II score; NRS, average pain last 24 hours, rated on a numerical rating scale before scanning; MNI, Montreal Neurological Institute.
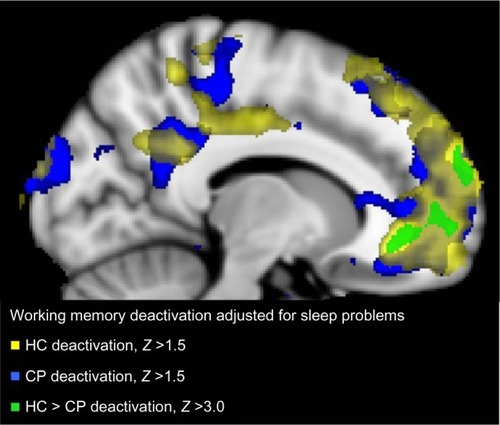
Table 4 Clusters of significantly increased or decreased activity in the CP versus HC groups during working memory fMRI
Table 5 Localization of maxima of increased and decreased BOLD signal in patients with CP versus HC for working memory tasks with sleep problems as main regressor and pain and depression scores orthogonalized