
Figures & data
Figure 1 ACL injection with fluoroscopy.
Abbreviation: ACL, anterior cruciate ligament.
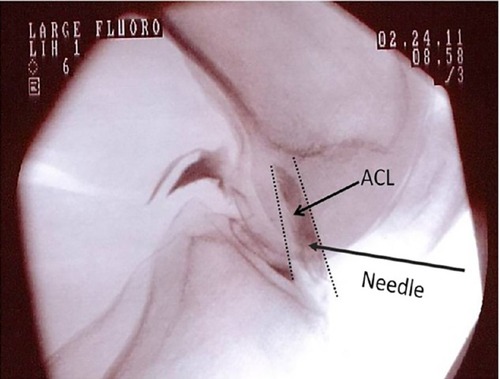
Figure 2 ACL tracing and resulting histogram.
Abbreviations: ACL, anterior cruciate ligament; max, maximum; min, minimum; StdDev, standard deviation.
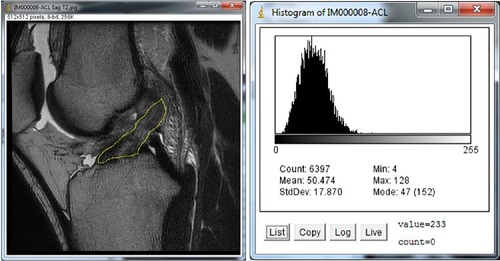
Table 1 NC count and volume injected for each patient
Figure 3 MRIs and histograms for Patient H, (A) pre- and (B) at 3.5 months posttreatment.
Note: A darker improved ACL image was seen on the posttreatment MRI, as well as the leftward shift of pixels toward darker values in the graph.
Abbreviations: ACL, anterior cruciate ligament; max, maximum; min, minimum; MRI, magnetic resonance imaging; StdDev, standard deviation.
Abbreviations: ACL, anterior cruciate ligament; max, maximum; min, minimum; MRI, magnetic resonance imaging; StdDev, standard deviation.
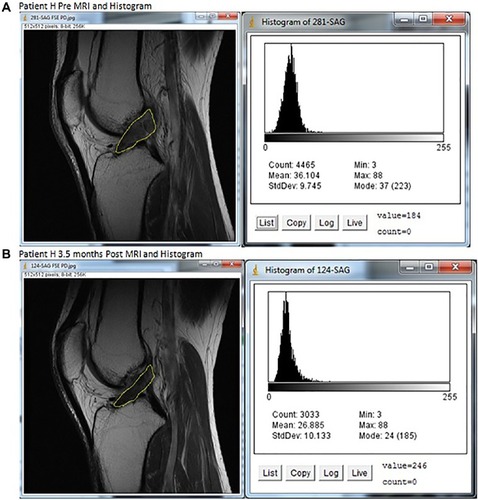
Figure 4 MRIs and histograms for Patient C, (A) pre- and (B) posttreatment.
Note: A darker improved ACL image was seen on the posttreatment MRI, as well as the leftward shift of pixels toward darker values in the graph.
Abbreviations: ACL, anterior cruciate ligament; max, maximum; min, minimum; MRI, magnetic resonance imaging; StdDev, standard deviation.
Abbreviations: ACL, anterior cruciate ligament; max, maximum; min, minimum; MRI, magnetic resonance imaging; StdDev, standard deviation.
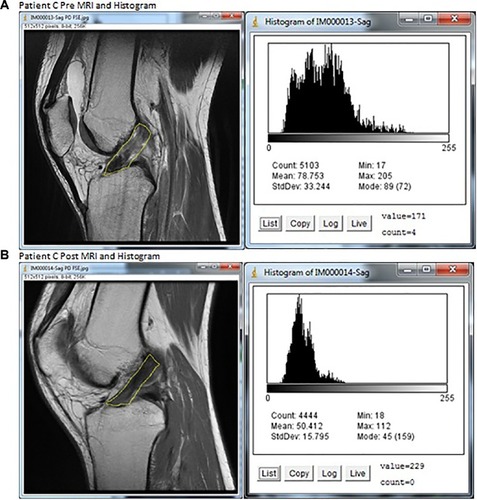
Figure 5 MRIs and histograms for Patient B, (A) pre- and (B) posttreatment.
Note: A darker improved ACL image was seen on the posttreatment MRI, as well as the leftward shift of pixels toward darker values in the graph.
Abbreviations: ACL, anterior cruciate ligament; max, maximum; min, minimum; MRI, magnetic resonance imaging; StdDev, standard deviation.
Abbreviations: ACL, anterior cruciate ligament; max, maximum; min, minimum; MRI, magnetic resonance imaging; StdDev, standard deviation.
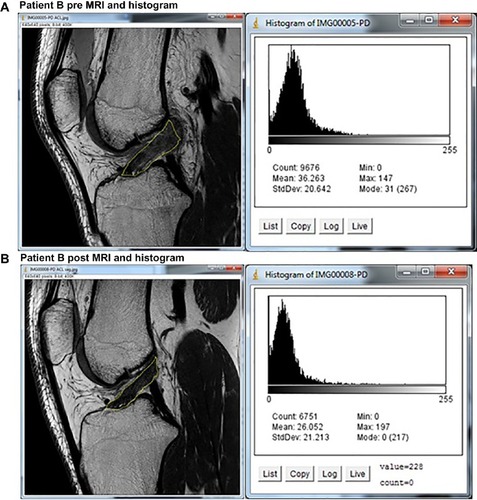
Table 2 Pre- to posttreatment histogram measurement change statistical analysis
Table 3 Patient clinical outcomes