Figures & data
Figure 1 Sequence alignment and secondary structure prediction of representative CoV envelope proteins.
Abbreviations: CoV, coronavirus; TGEV, the porcine transmissible gastroenteritis virus; MHV, murine hepatitis virus; SARS-CoV, severe acute respiratory syndrome coronavirus; IBV, infectious bronchitis virus; TM, transmembrane.
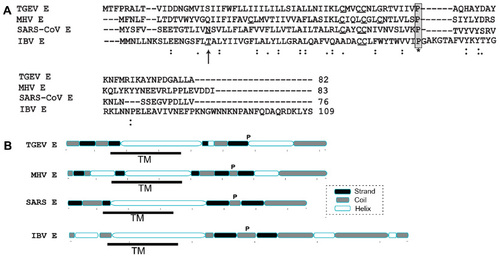
Figure 2 NMR-based models of SARS-CoV E proteins.
Abbreviations: NMR, nuclear magnetic resonance; SARS-CoV, severe acute respiratory syndrome coronavirus; TM, transmembrane; SDS, sodium dodecyl sulphate.
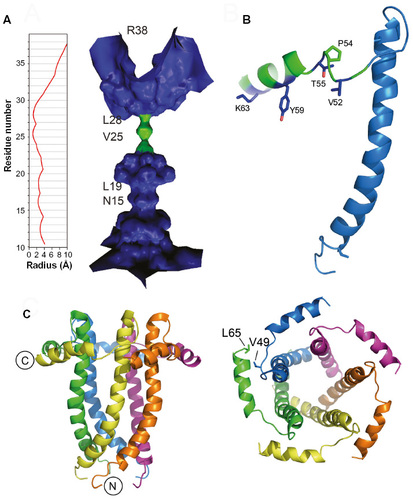
Figure 3 Sequences of hRSV SH protein and homologs in paramyxoviruses.
Abbreviations: hRSV, human respiratory syncytial virus; SH, small hydrophobic; TM, transmembrane; RSV, respiratory syncytial virus; DPC, dodecylphosphocholine.
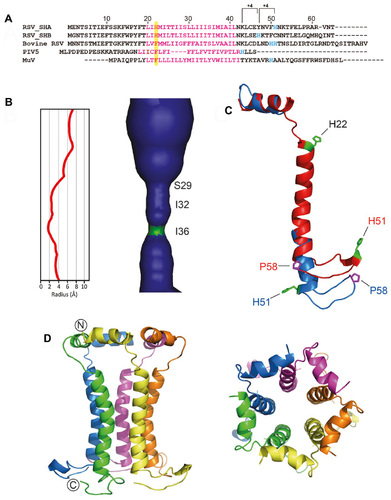
Figure 4 Binding sites of inhibitors in SARS-CoV E and SH proteins. (A) Superposition of TROSY-HSQC spectra of uniformly 15N-labeled SARS-CoV E in the absence (red) and presence (blue) of 0.4 mM HMA (shown above image A). Peaks that undergo significant shifts upon complex formation are highlighted; (B) residues showing larger and smaller shifts are represented in red and yellow, respectively; (C) same as (A) for uniformly 15N-labeled SH protein in the absence (red) and presence (blue) of 4.8 mM pyronin B (shown above image C). (D) Residues showing larger and smaller shifts are represented in red and yellow, respectively.
Abbreviations: SARS-CoV, severe acute respiratory syndrome coronavirus; SH, small hydrophobic; HMA, hexamethylene amiloride; TROSY-HSQC, transverse relaxation-optimized spectroscopy-heteronuclear single quantum coherence.
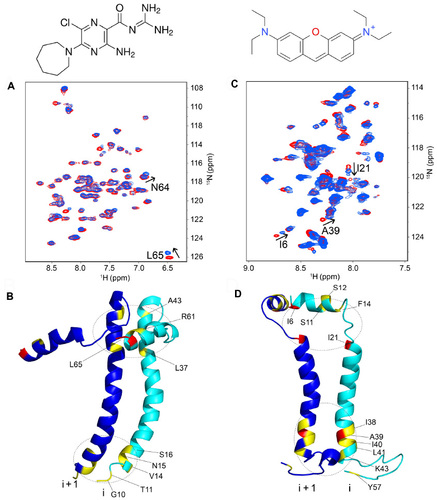
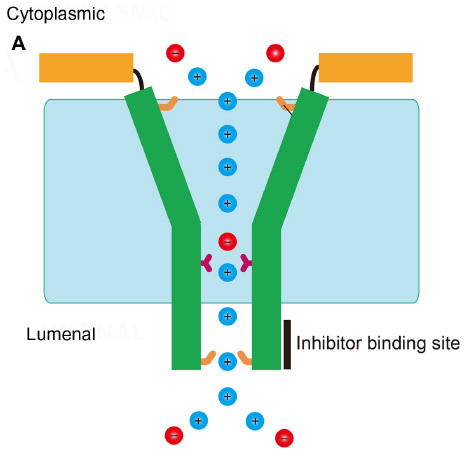
Figure 5 Common features in SARS-CoV E and RSV SH channels.
Abbreviations: SARS-CoV, severe acute respiratory syndrome coronavirus; SH, small hydrophobic; RSV, respiratory syncytial virus.