
Figures & data
Table 1 Demographic data of the patients
Table 2 Initial foot temperatures (°C)
Figure 1 Demonstration of application of SCCD.
Abbreviation: SCCD, sequential contraction compression device.
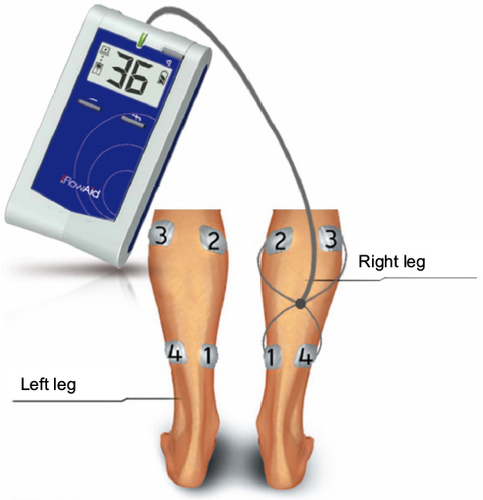
Figure 2 Infrared thermography before and after treatment with the SCCD
Note: (A) Before and (B) after, treated (left) and nontreated (right) legs.
Abbreviation: SCCD, sequential contraction compression device.
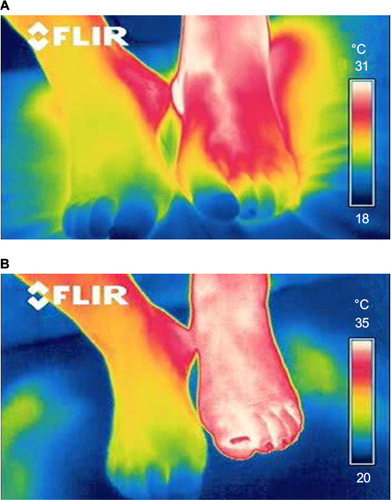
Table 3 Changes in foot temperatures after treatment with SCCD (°C)