Figures & data
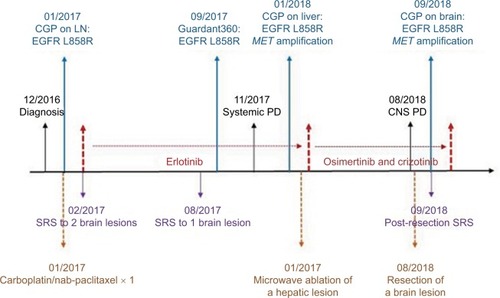
Figure 1 Copy number plot for the liver biopsy sample tested before combination therapy of osimertinib and crizotinib.
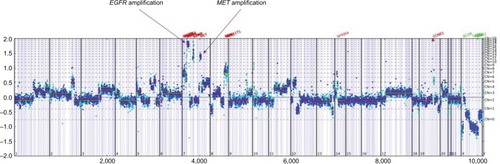
Table 1 List of genomic alterations detected from three different metastatic sites over the clinical course
Figure 2 CT images showing the right apex lung mass before (A & D), 8 weeks after (B & E), and 28 weeks after (C & F) combination therapy of osimertinib and crizotinib. The red arrows indicate the right apex lung mass seen on the axial view (A–C) as well as the coronal view (D–F). CT images showing a hepatic mass before (G), 8 weeks after (H), and 28 weeks after (I) combination therapy of osimertinib and crizotinib. This patient also received microwave ablation of this hepatic mass prior to initiation of the combination therapy. MRI images showing the posterior left temporal lobe mass 18 weeks after (J) and 28 weeks after (K) combination therapy of osimertinib and crizotinib. The red circles clearly indicate disease progression at 28 weeks as demonstrated by the interval increase in size of the mass. Of note, this mass had previously received stereotactic radiation. The patient subsequently underwent total resection of the mass (L).
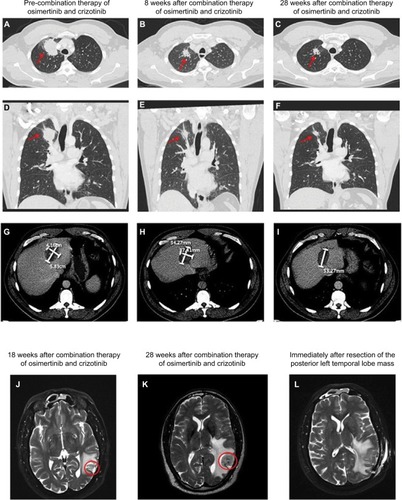
Figure 3 Schematic summary of treatment course.