
Figures & data
Figure 1 Color matrix showing OS benefit or lack of benefit by stage among the large adjuvant platinum-based chemotherapy or other adjuvant chemotherapy versus observation. Red box indicated no OS benefit. Yellow box indicated OS benefit determined retrospectively or OS did not persist overtime. Green box indicated OS benefit. White box indicated that particular stage was not investigated in the trial.
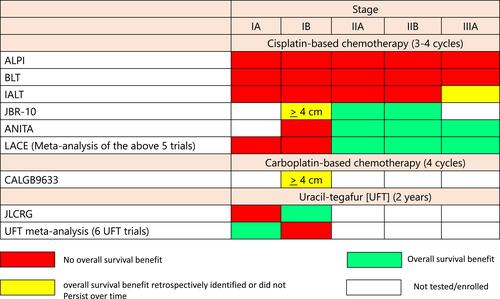
Figure 2 Bar-charts showing the percentage of patients who received adjuvant chemotherapy by stage (IB, II, III) and by treatment arms (Osimertinib, placebo).
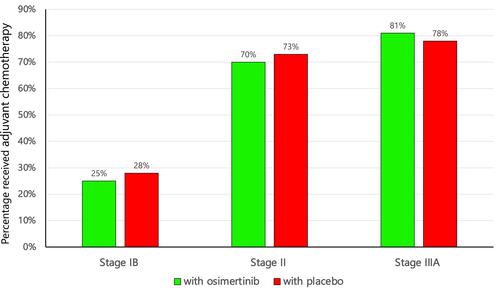
Figure 3 Side by side comparison of 2-year Disease-free survival (DFS) by treatment arms according to stage.
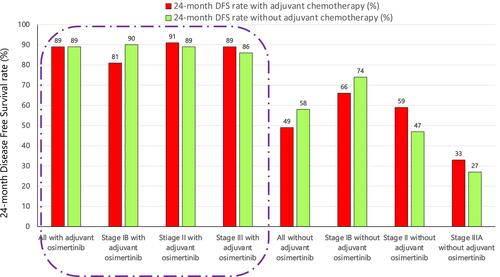
Table 1 Percentages of Patients Completed the Full Planned Adjuvant Platinum-Based Chemotherapy