Figures & data
Table 1 Baseline Clinical, Treatment, and Response Factors of 106 Patients with Stage III NSCLC
Figure 1 Absolute Lymphocyte Count (x103/µL) for each patient during and following completion of chemoradiation.
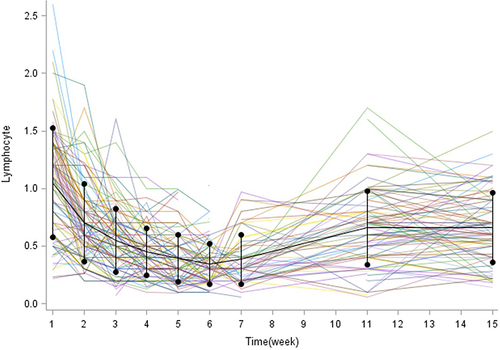
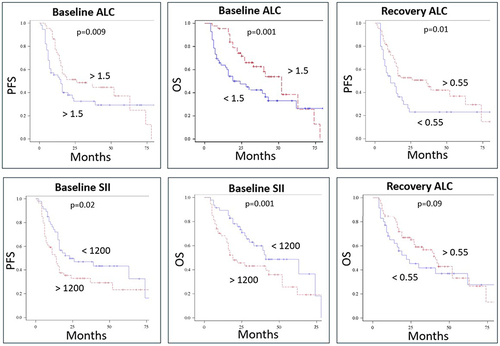
Table 2 Statistical Significance of Kaplan-Meier Estimates for OS and PFS Based on Baseline Absolute Lymphocyte Count (ALC), Baseline SII, and Recovery ALC, Dichotomized by Median Split and Compared with Wilcoxon Tests
Figure 2 Estimates for OS and PFS based on baseline absolute lymphocyte count (ALC), baseline SII, and recovery ALC, dichotomized by median split.